Fig. 5
Download original image
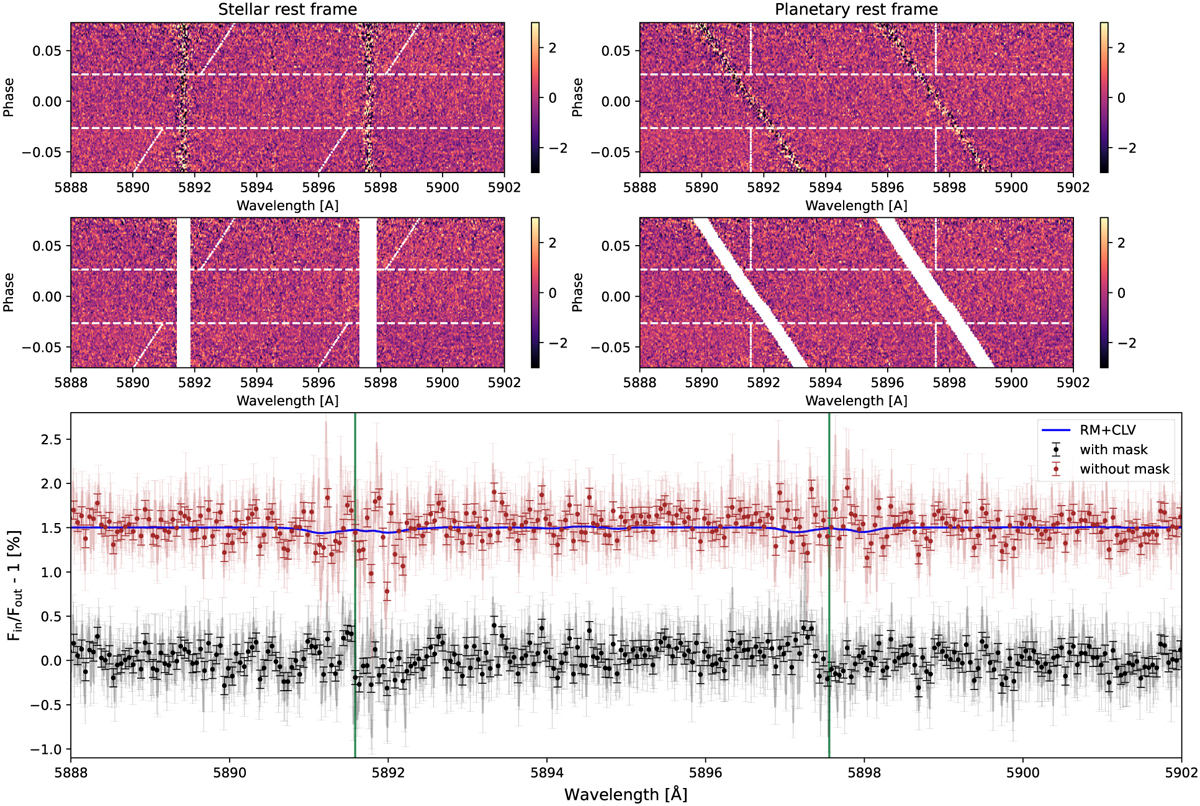
2D map of the individual transmission spectra around the Na I doublet lines of WASP-122b (top) in the stellar (left) and planetary (right) rest frame. Middle panel shows the same as the top panels, but masking the stellar signal of the Na I doublet lines (presented mask size ± 0.2 Å). Bottom panel gives the transmission spectrum computed by combining the data between the first and fourth contacts of the transit, indicated in the top panel. The red plot was computed without masking the stellar Na I lines, and the black plot with masking of these lines. Blue line represents the RM and CLV effects model. We have chosen not to show the TS after removal since the effect is marginal. The green vertical lines indicate the laboratory position of the Na I doublet lines.
Current usage metrics show cumulative count of Article Views (full-text article views including HTML views, PDF and ePub downloads, according to the available data) and Abstracts Views on Vision4Press platform.
Data correspond to usage on the plateform after 2015. The current usage metrics is available 48-96 hours after online publication and is updated daily on week days.
Initial download of the metrics may take a while.