Open Access
Fig. 2
Download original image
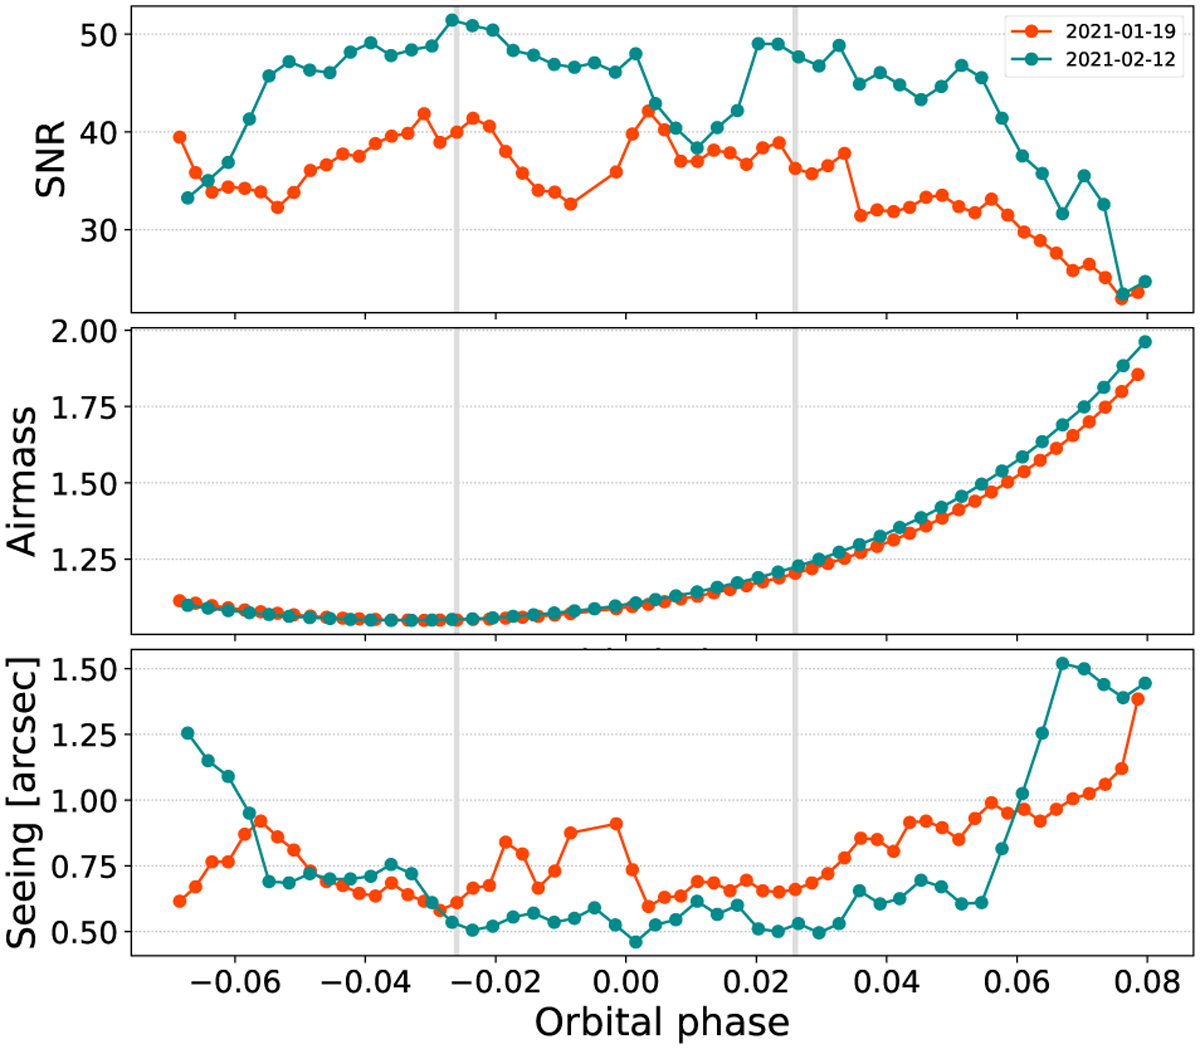
S/N (top panel) in the Na I echelle order (order 104), airmass (middle panel), and seeing (calculated as the mean seeing at the beginning and end of the exposure) evolution during the two nights of observations. Gray vertical lines represent the beginning (T1) and end (T4) of the transit.
Current usage metrics show cumulative count of Article Views (full-text article views including HTML views, PDF and ePub downloads, according to the available data) and Abstracts Views on Vision4Press platform.
Data correspond to usage on the plateform after 2015. The current usage metrics is available 48-96 hours after online publication and is updated daily on week days.
Initial download of the metrics may take a while.