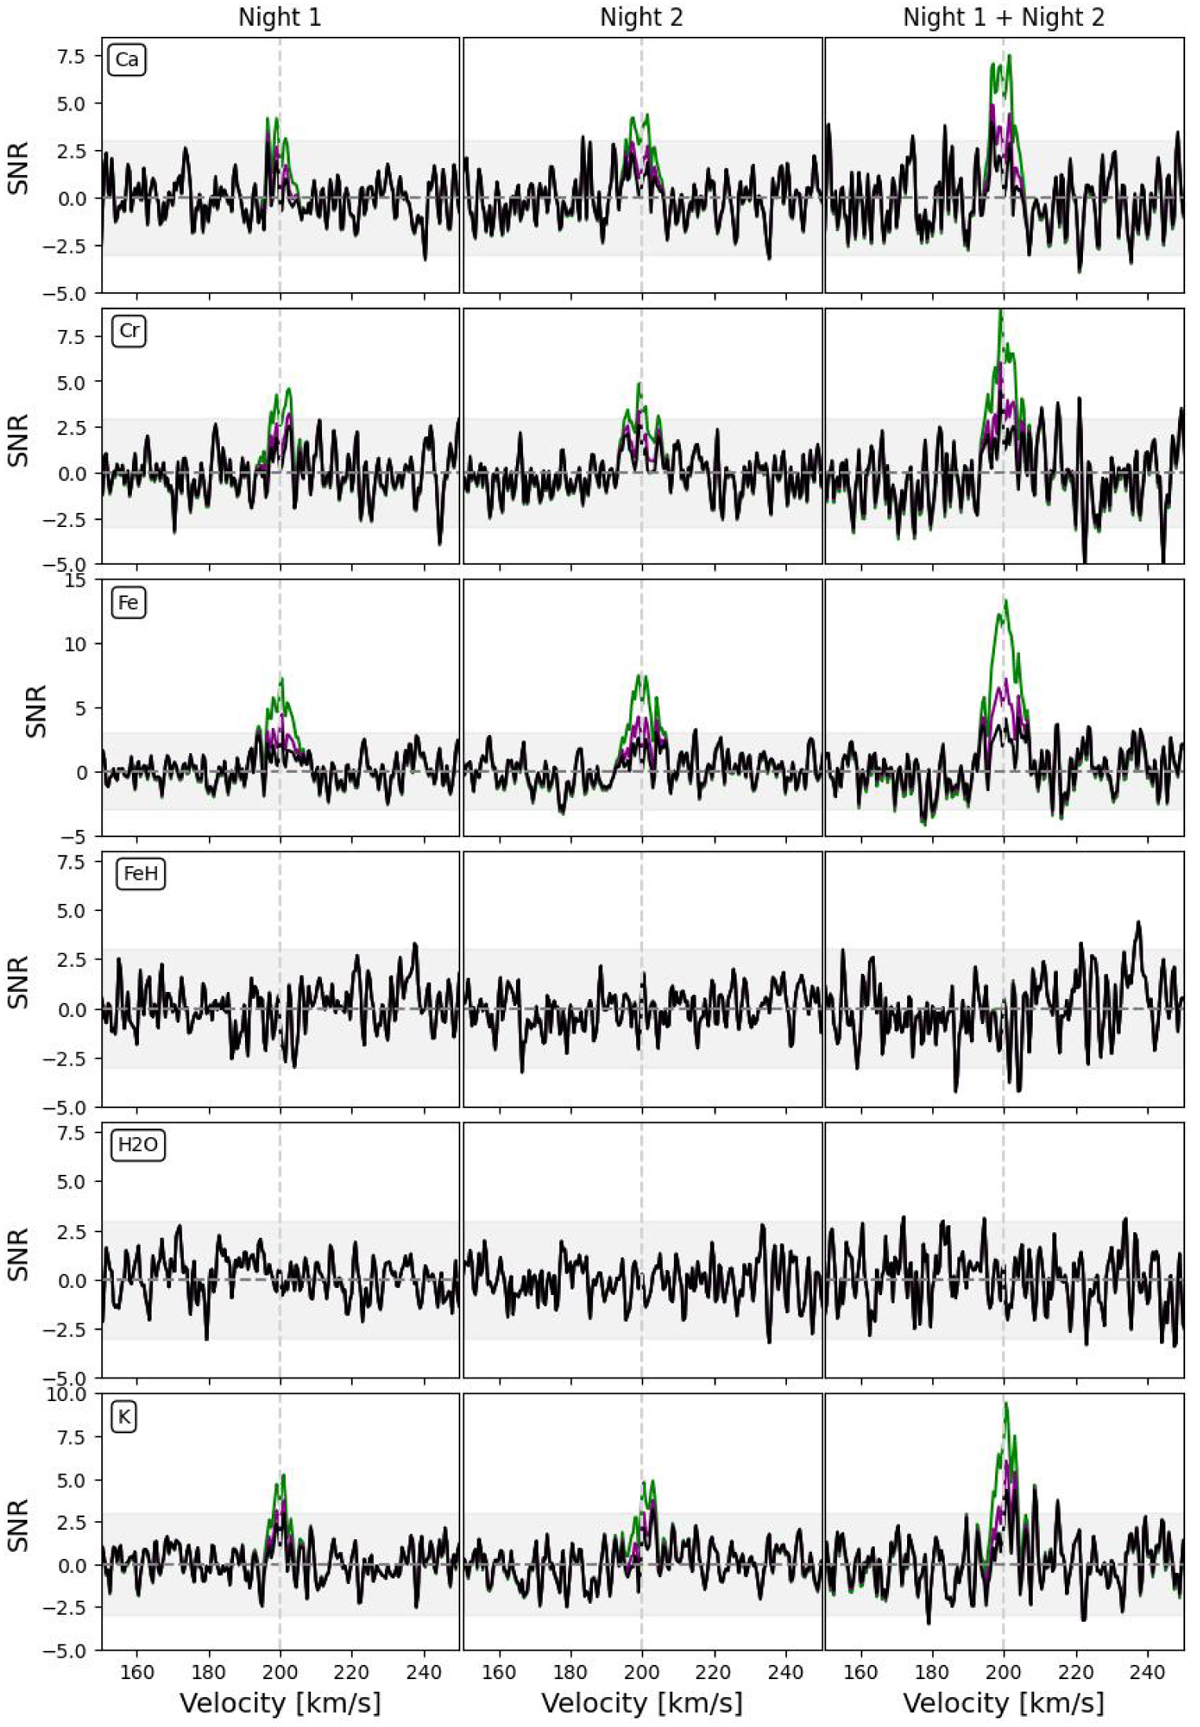
Fig. A.7
Download original image
S/N plots after injecting the signal of Ca I, Cr I, Fe I, FeH, H2O, and K I. In the first column, we present the injection of the species into the data from Night 1, in the second column into Night 2, and in the third column, we present data after combining Night 1 and Night 2. The black plots represent the injected signal with an expected strength of the signal, the purple plot with a 2x of the expected signal, and the green with a 4x strength of the injected signal. The horizontal gray dashed line represents S/N = 0, and the vertical gray dashed line represents the radial velocity of 0 km/s. The gray regions represent S/N between −3 and 3.
Current usage metrics show cumulative count of Article Views (full-text article views including HTML views, PDF and ePub downloads, according to the available data) and Abstracts Views on Vision4Press platform.
Data correspond to usage on the plateform after 2015. The current usage metrics is available 48-96 hours after online publication and is updated daily on week days.
Initial download of the metrics may take a while.