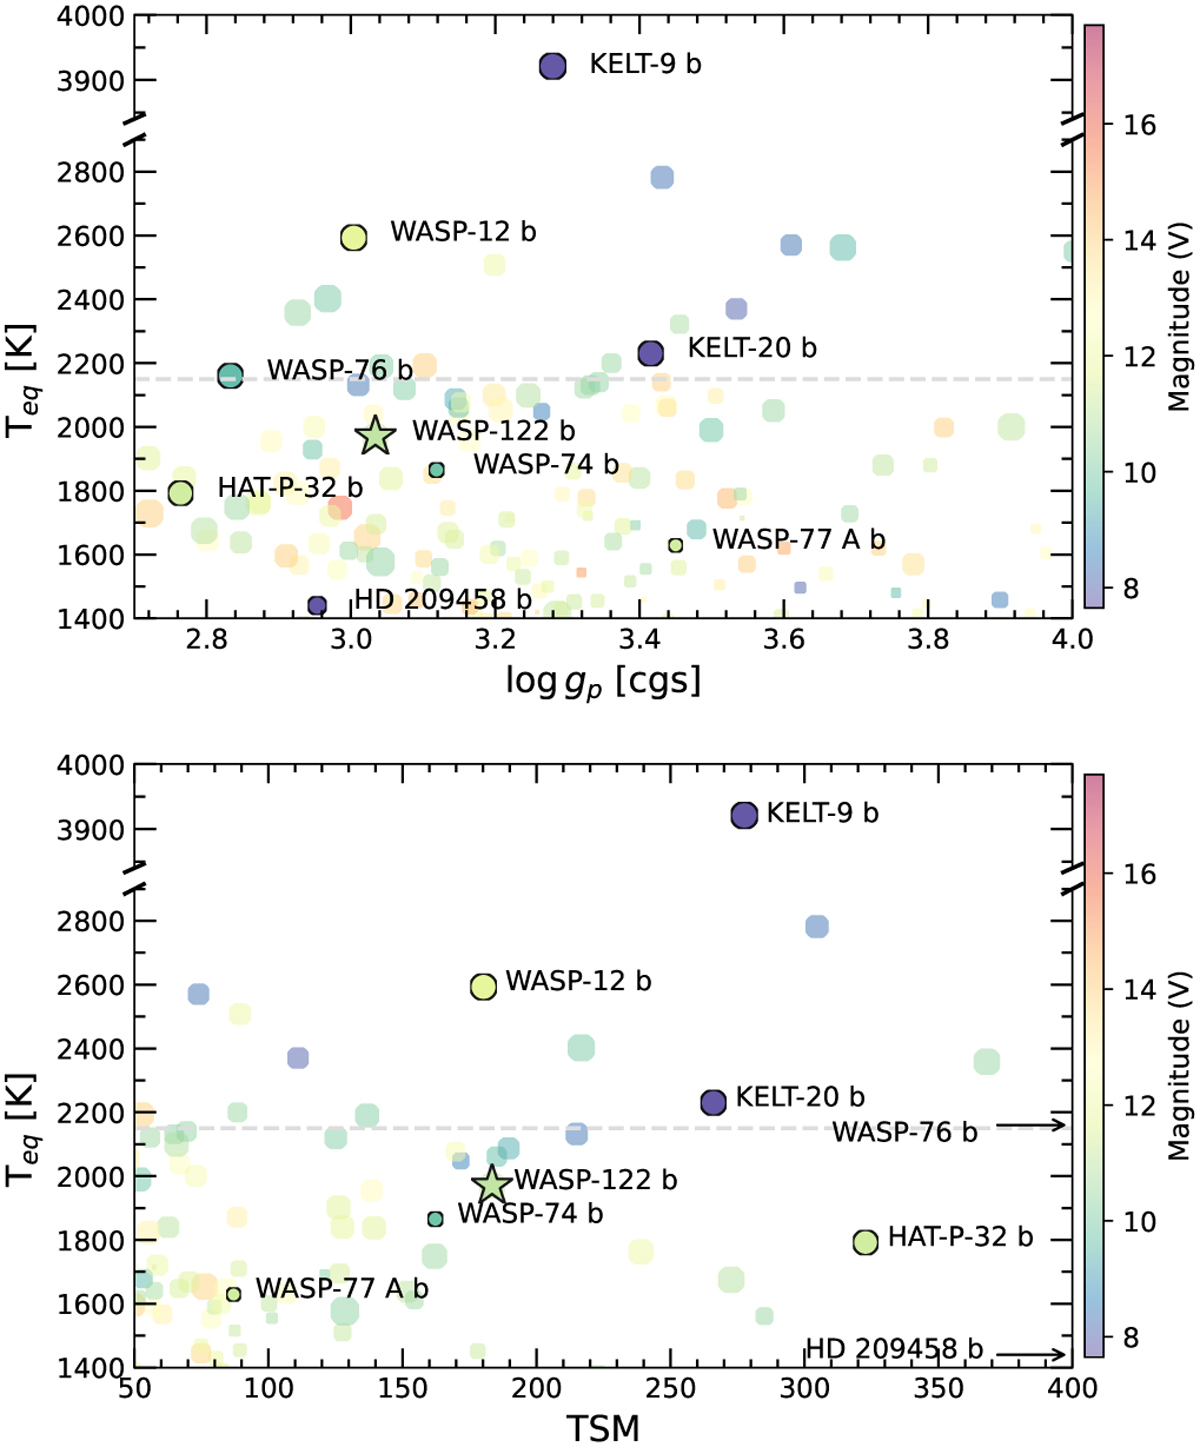
Fig. 1
Download original image
Context of WASP-122b, marked with a star symbol, with respect to all known planets with Teq > 1400K and Rp > 0.6 RJ. The equilibrium temperature is plotted on the vertical axis and surface gravity (top panel), and the transmission spectroscopy metrics (bottom panel) are plotted on the horizontal axis. The gray horizontal line in the temperature where we differentiate the HJ and UHJ according to Stangret et al. (2022) at 2150 K. For both figures, the size of the marker indicates the planetary radius and the V -band magnitude of the host star is color- coded.
Current usage metrics show cumulative count of Article Views (full-text article views including HTML views, PDF and ePub downloads, according to the available data) and Abstracts Views on Vision4Press platform.
Data correspond to usage on the plateform after 2015. The current usage metrics is available 48-96 hours after online publication and is updated daily on week days.
Initial download of the metrics may take a while.