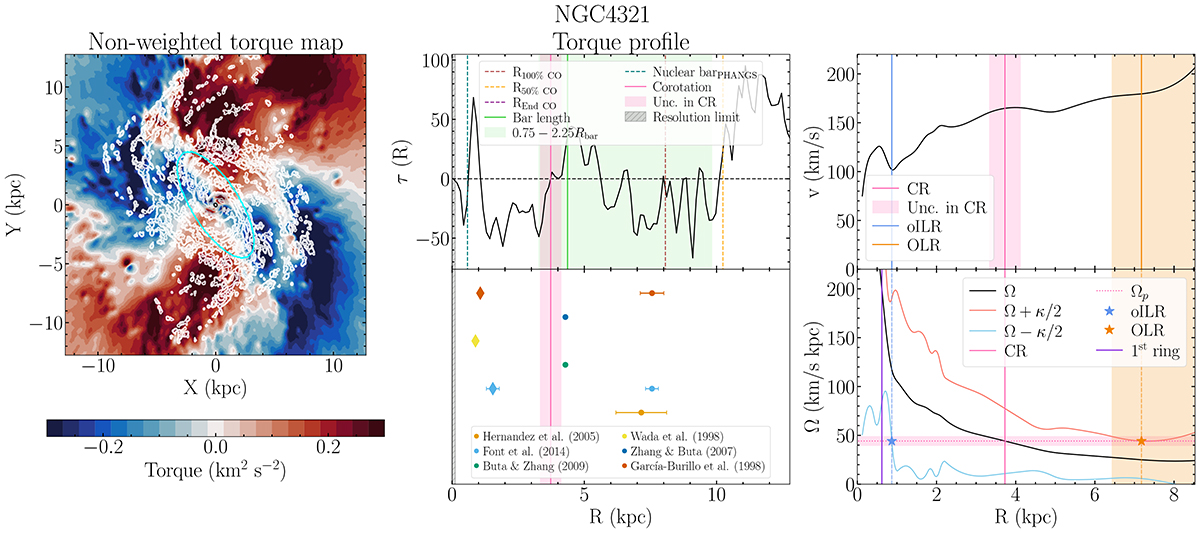
Fig. 5.
Download original image
NGC 4321 (SAB) non-weighted deprojected torque map (left panel), torque profile (upper central panel), comparison with values from the literature (lower central panel), rotation curve (upper right panel), and angular rotation curve (lower right panel). We show contours corresponding to [5σ, 15σ, 45σ, …, 0.9σmax] in the CO map, where σ is the mean value of the gas map σ = 1.08 K km s−1 and σmax = 885.64 K km s−1. The teal dashed line represents the nuclear bar radius registered by Querejeta et al. (2021). Symbols as in Fig. 3.
Current usage metrics show cumulative count of Article Views (full-text article views including HTML views, PDF and ePub downloads, according to the available data) and Abstracts Views on Vision4Press platform.
Data correspond to usage on the plateform after 2015. The current usage metrics is available 48-96 hours after online publication and is updated daily on week days.
Initial download of the metrics may take a while.