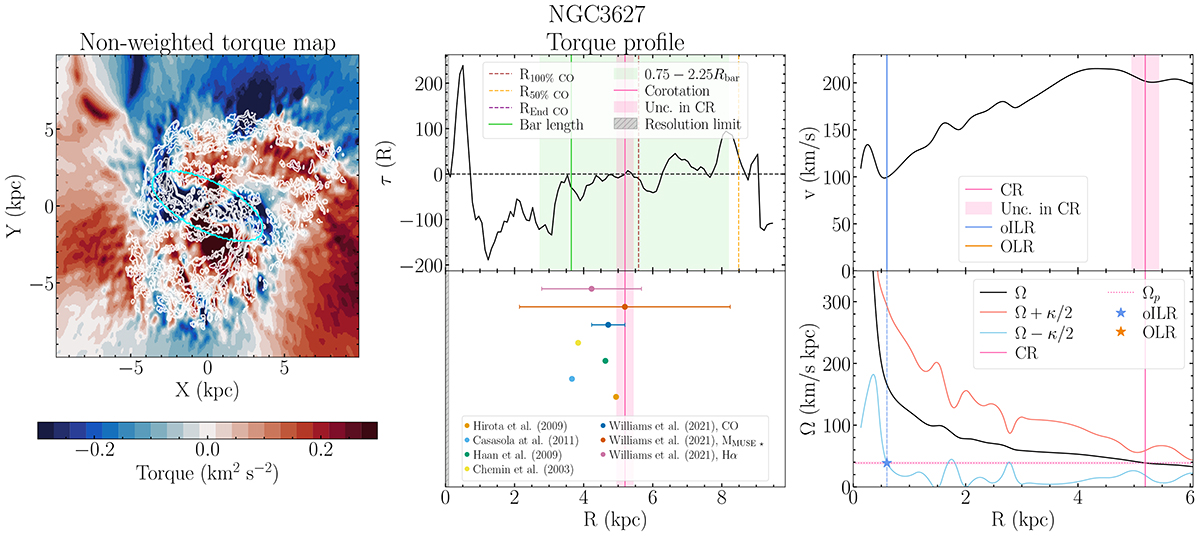
Fig. 4.
Download original image
NGC 3627 (SB) non-weighted deprojected torque map (left panel), torque profile (upper central panel), comparison with values from the literature (lower central panel), rotation curve (upper right panel), and angular rotation curve (lower right panel). We show contours corresponding to [5σ, 15σ, 45σ, …, 0.9σmax] in the CO map, where σ is the mean value of the gas map σ = 1.21 K km s−1 and σmax = 1394.02 K km s−1. Symbols as in Fig. 3. The CR is automatically selected as RCR = 5.2 kpc, due to the change of torques signs at this position and the amplitude of the crossing. R = 3.5 kpc is not selected as the CR because the torque profile does not change sign at this position. R = 6.3 kpc is not selected as the CR because, even though the torque profile changes sign, it oscillates around zero (a behavior usually associated with the presence of a spiral) and presents a lower amplitude (compared to RCR = 5.2 kpc ).
Current usage metrics show cumulative count of Article Views (full-text article views including HTML views, PDF and ePub downloads, according to the available data) and Abstracts Views on Vision4Press platform.
Data correspond to usage on the plateform after 2015. The current usage metrics is available 48-96 hours after online publication and is updated daily on week days.
Initial download of the metrics may take a while.