Fig. 3.
Download original image
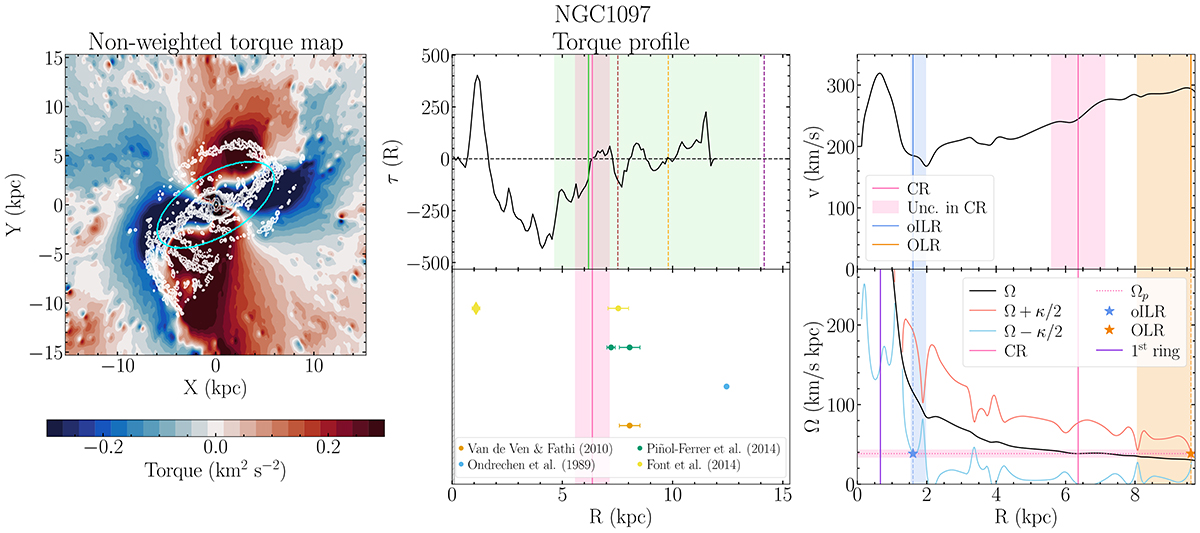
NGC 1097 (SB) non-weighted deprojected torque map (left panel), torque profile (upper central panel), comparison with values from the literature (lower central panel), rotation curve (upper right panel), and angular rotation curve (lower right panel). The cyan-contoured ellipse in the left panel indicates the bar extent. We show contours corresponding to [5σ, 15σ, 45σ, …, 0.9σmax] in the CO map, where σ is the mean value of the gas map σ = 0.59 K km s−1, and σmax = 934.83 K km s−1. In the central and right panels, CR is represented as a vertical pink line, together with its uncertainties (pink-shaded area). This is a statistical uncertainty due to bootstrapping for i, PA and center position (see Sect. 3.5). The solid green line represents the bar length (from Querejeta et al. 2021), while the shaded green region represents the region where we search for the CR. Brown dashed line marks the radius at which the coverage of CO starts to be nonuniform (R100% CO in Table A.1), orange dashed line is the radius at which the coverage of CO is uniform about 50% (R50% CO in Table A.1), and purple dashed line represents the end of CO coverage (REnd CO in Table A.1). The shaded gray region represents the inner region inside which we cannot say anything on τ(R) due to the limited spatial resolution of our observations. Finally, in the lower central panel, each dot represents a different measure of the CR (of the main bar) from the literature, and the ⬧ symbol represents a measure of a nuclear bar CR. For both right panels, the solid black line represents the rotation curve (upper panel) and the angular rotation curve Ω (lower panel). Solid light pink and light blue lines represent Ω + κ/2 and Ω − κ/2, respectively. The OLR and its uncertainties are represented in orange and the oILR (and its uncertainties) in dark blue. Purple vertical line represents the central ring detected by Querejeta et al. (2021).
Current usage metrics show cumulative count of Article Views (full-text article views including HTML views, PDF and ePub downloads, according to the available data) and Abstracts Views on Vision4Press platform.
Data correspond to usage on the plateform after 2015. The current usage metrics is available 48-96 hours after online publication and is updated daily on week days.
Initial download of the metrics may take a while.