Fig. 8
Download original image
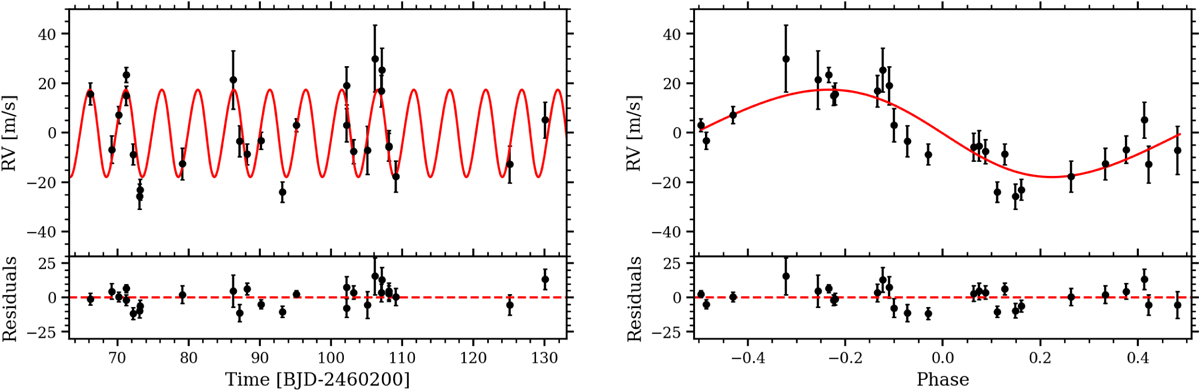
TOI-6651 RVs (black dots) from 27 spectroscopic observations with PARAS-2 are plotted with time (on the left). TOI-6651 RVs plotted with orbital phase (on the right). In both plots, the best-fit RV model with EXOFASTv2 is represented by the red line, and residuals between the best-fit model and the data are shown in their respective lower panel.
Current usage metrics show cumulative count of Article Views (full-text article views including HTML views, PDF and ePub downloads, according to the available data) and Abstracts Views on Vision4Press platform.
Data correspond to usage on the plateform after 2015. The current usage metrics is available 48-96 hours after online publication and is updated daily on week days.
Initial download of the metrics may take a while.