Fig. 5
Download original image
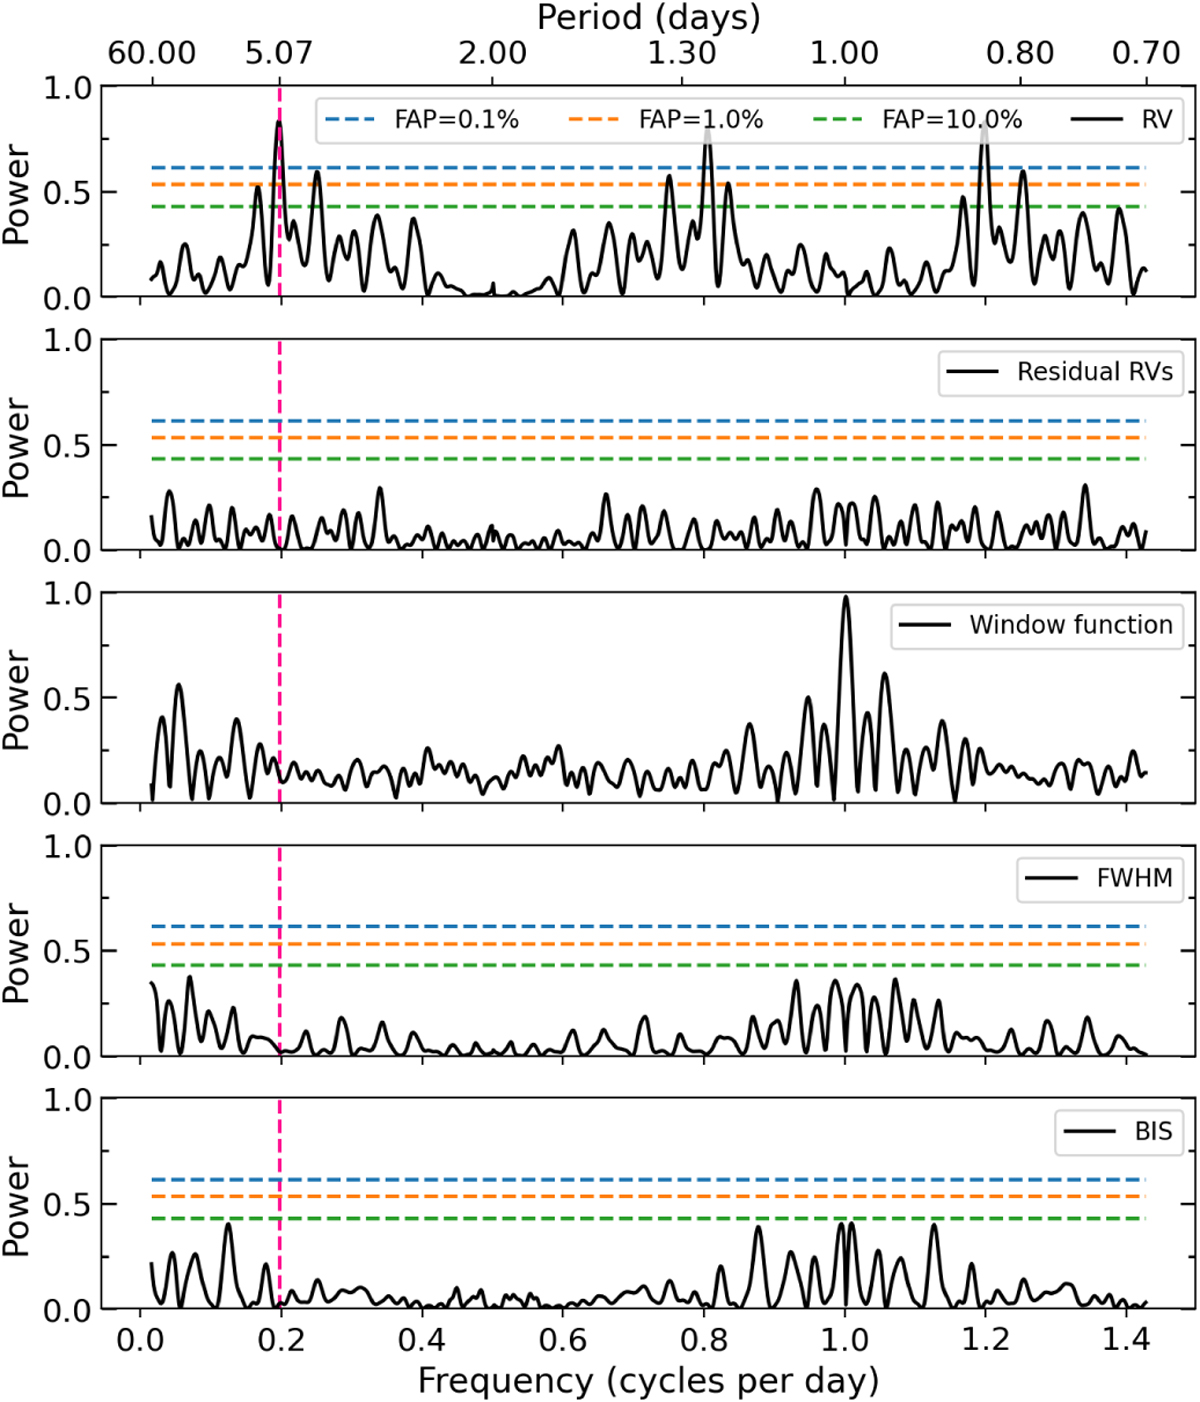
GLS periodogram for the RVs, residual RVs, window function, FWHM, and bisector span of TOI-6651 are shown in panels 1–5 (top to bottom), respectively. The most significant period in RVs is found to be 5.070 days, denoted by a pink dashed vertical line, which is consistent with the period 5.057 days found in the TESS transit signal. The FAP levels corresponding to 0.1, 1.0, and 10.0% are shown in horizontal blue, orange, and green dashed lines, respectively.
Current usage metrics show cumulative count of Article Views (full-text article views including HTML views, PDF and ePub downloads, according to the available data) and Abstracts Views on Vision4Press platform.
Data correspond to usage on the plateform after 2015. The current usage metrics is available 48-96 hours after online publication and is updated daily on week days.
Initial download of the metrics may take a while.