Open Access
Fig. B.1
Download original image
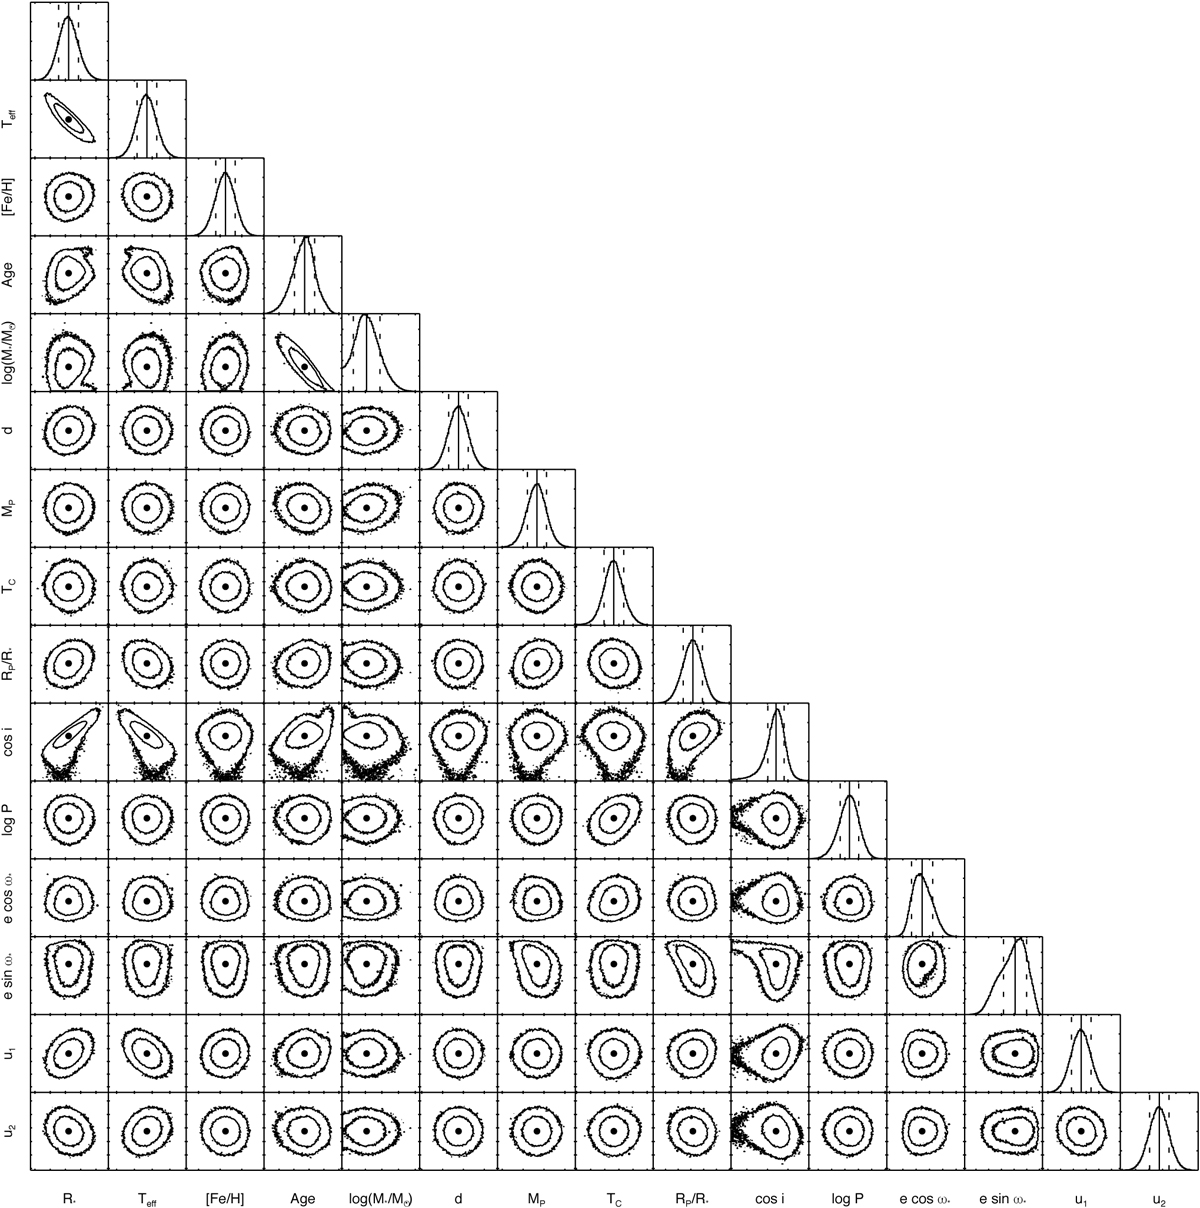
Corner plot showing the covariances for the fitted parameters from EXOFASTv2, corresponding to the high-mass solution (most probable) after splitting the bimodal distribution. The inner and outer contours around the median value represent the 68% and 95% confidence intervals, respectively.
Current usage metrics show cumulative count of Article Views (full-text article views including HTML views, PDF and ePub downloads, according to the available data) and Abstracts Views on Vision4Press platform.
Data correspond to usage on the plateform after 2015. The current usage metrics is available 48-96 hours after online publication and is updated daily on week days.
Initial download of the metrics may take a while.