Fig. 1
Download original image
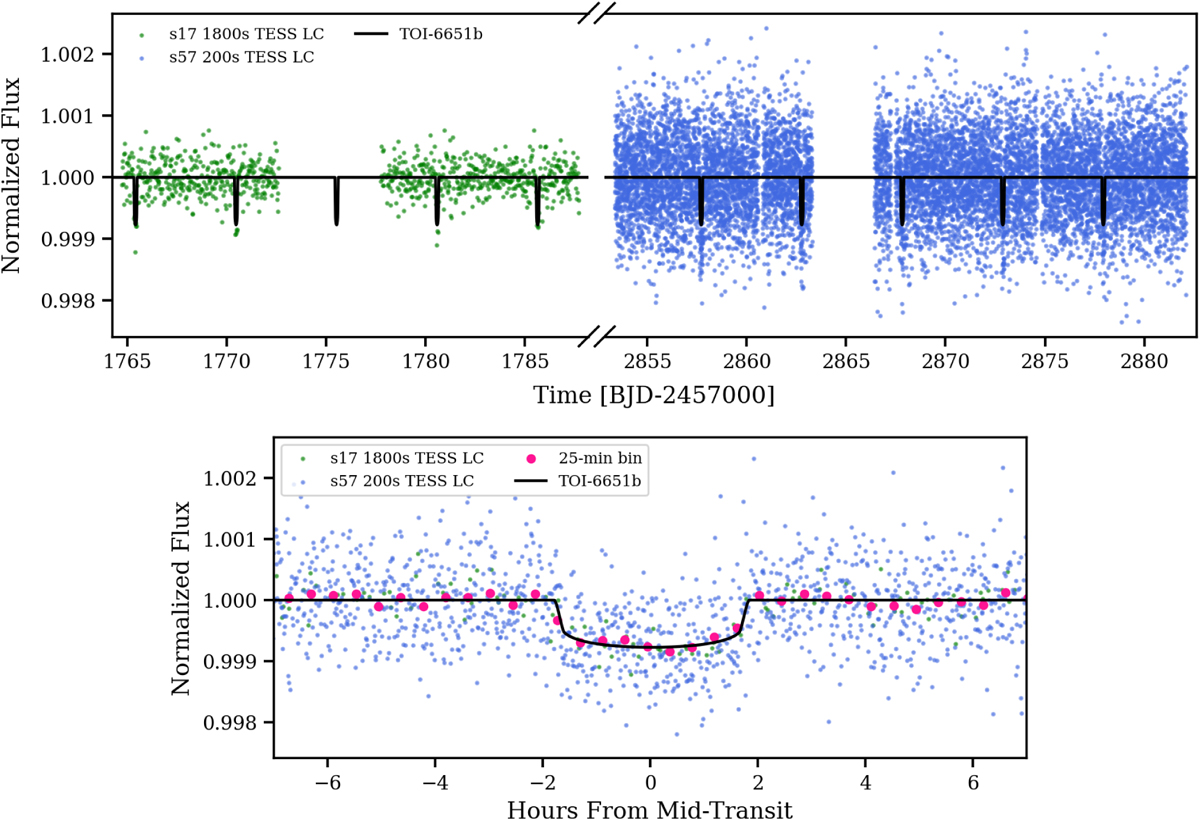
Detrended TESS light curve (LC) from sector 17 (1800-second cadence) and 57 (200-second cadence) shown in green and blue points, respectively. The upper panel displays the full TESS LC plotted against time, while the lower panel presents the phase-folded LC with pink dots representing 25-minute binned data points. The black solid line in both panels represents the best-fit transit model for TOI-6651b from our joint fit analysis (see Section 3.5).
Current usage metrics show cumulative count of Article Views (full-text article views including HTML views, PDF and ePub downloads, according to the available data) and Abstracts Views on Vision4Press platform.
Data correspond to usage on the plateform after 2015. The current usage metrics is available 48-96 hours after online publication and is updated daily on week days.
Initial download of the metrics may take a while.