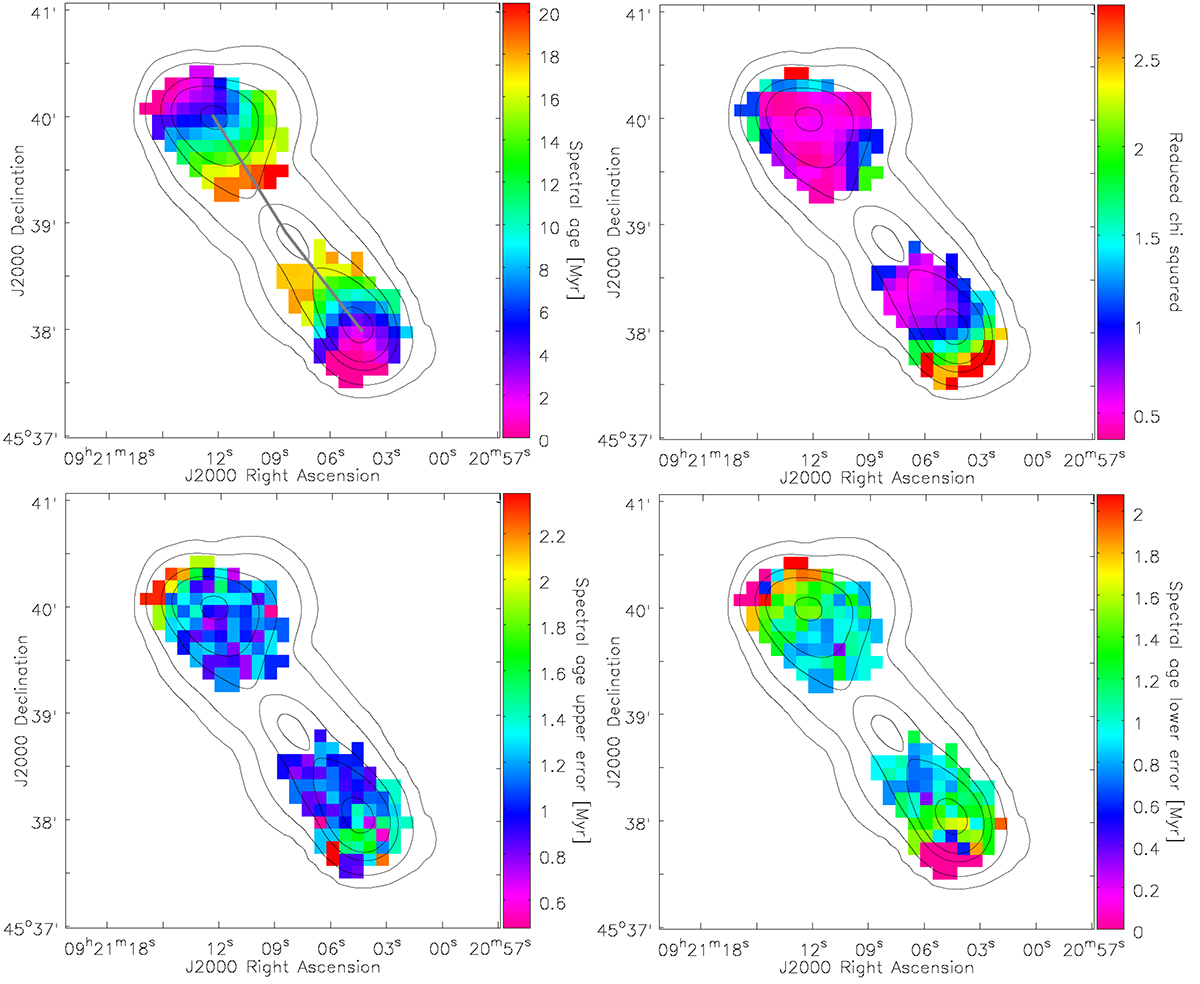
Fig. 4.
Download original image
Results of spectral aging analysis for the outer structure of 3C 219 presented with color maps, with color bars representing scales given next to each panel. In each panel, a 4.89 GHz contour map is overlaid for reference. The contour levels are (3, 39, 267, 600, 1830)×0.17 mJy/b.a.. The size of the circular beams for the color and contour maps is 20″. Top left: Spectral age map. The gray line marks a section through the source, the results of which are presented in Fig. 8Top right: χred2 map. Regions with χred2 > 2.8 (99% confidence level) are marked in red. Bottom left: Upper error map of the spectral age. Bottom right: Lower error map of the spectral age.
Current usage metrics show cumulative count of Article Views (full-text article views including HTML views, PDF and ePub downloads, according to the available data) and Abstracts Views on Vision4Press platform.
Data correspond to usage on the plateform after 2015. The current usage metrics is available 48-96 hours after online publication and is updated daily on week days.
Initial download of the metrics may take a while.