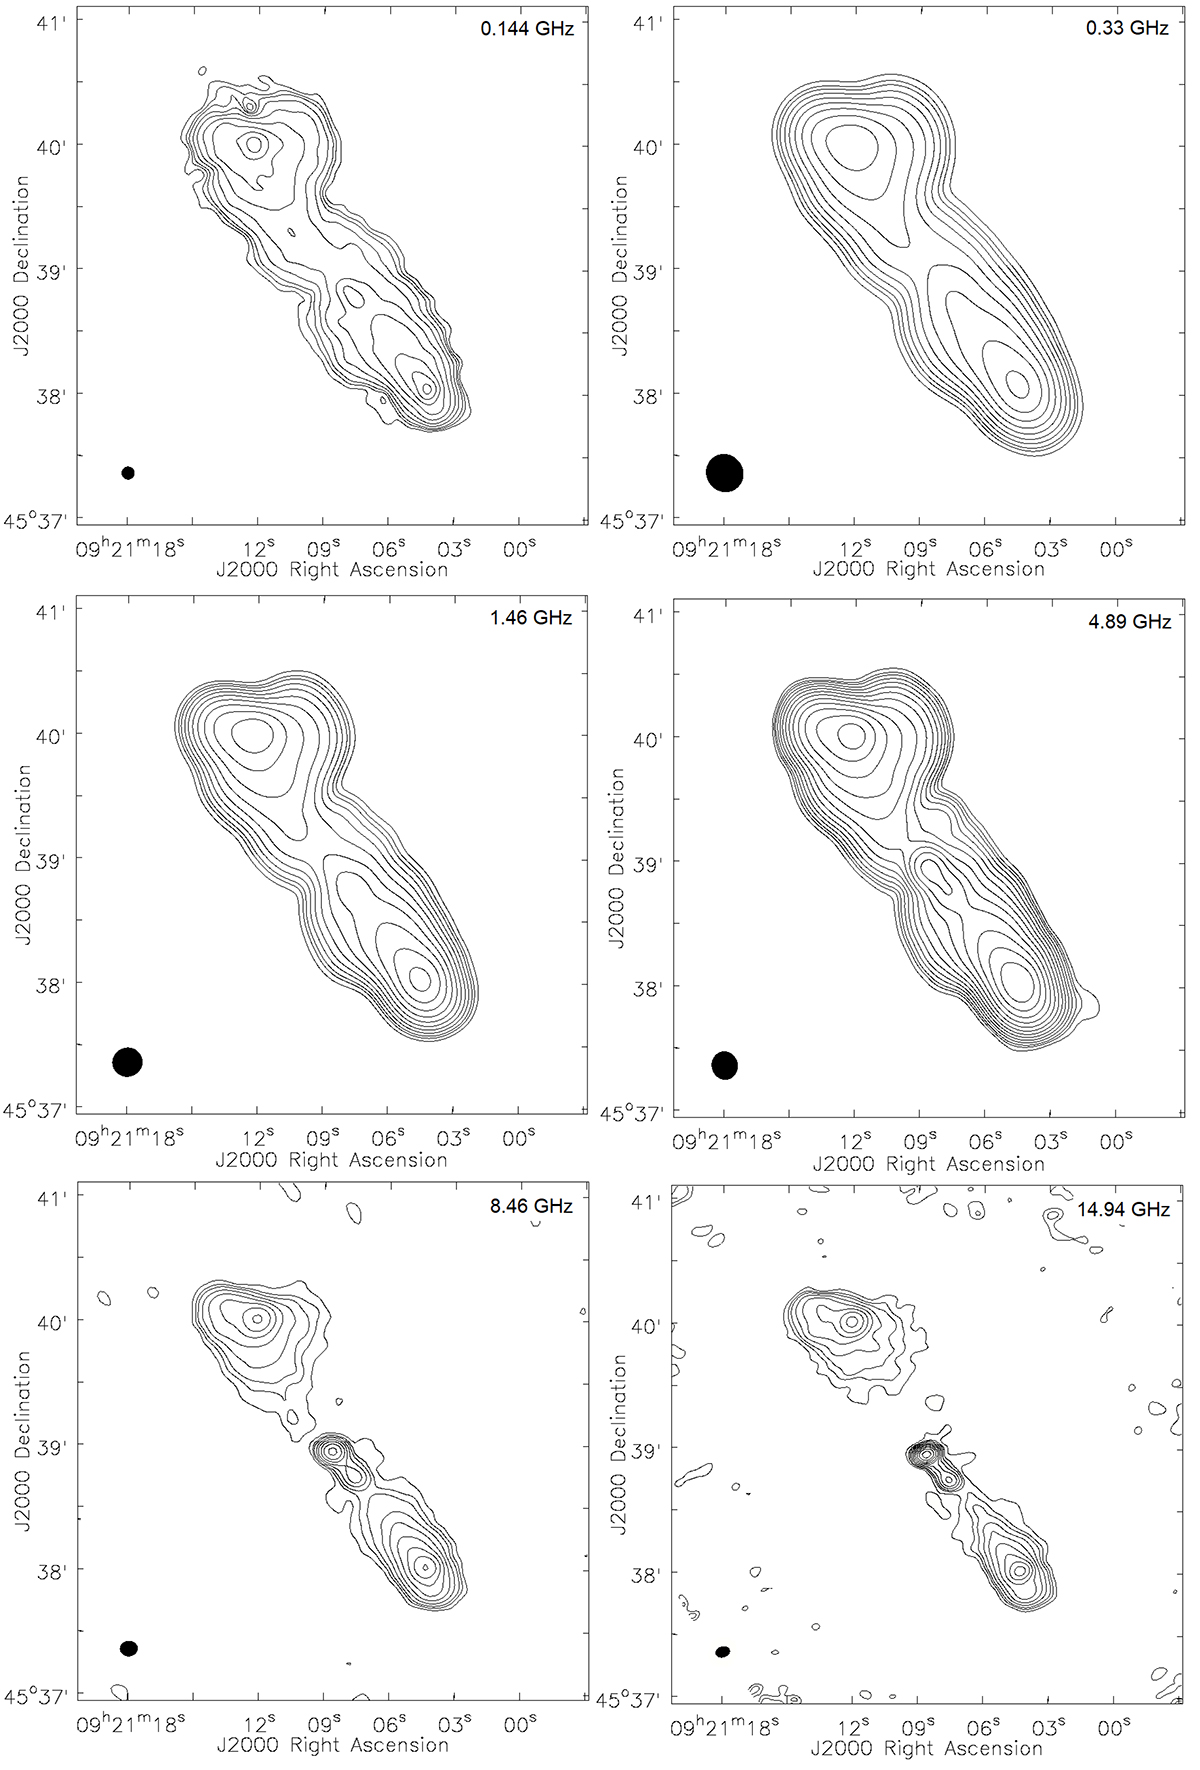
Fig. 1.
Download original image
Total intensity contour maps of 3C 219, showing changes in its morphology over the entire available frequency range. The contour levels are (3, 6, 9, 15, 24,39, 63, 102, 165, 267, 432, 699, 1131)×σrms. The basic properties of individual maps together with noise levels, σrms, are given in Table 1. Beams are shown in the bottom-left corners and center frequencies in the top-right corners of each panel.
Current usage metrics show cumulative count of Article Views (full-text article views including HTML views, PDF and ePub downloads, according to the available data) and Abstracts Views on Vision4Press platform.
Data correspond to usage on the plateform after 2015. The current usage metrics is available 48-96 hours after online publication and is updated daily on week days.
Initial download of the metrics may take a while.