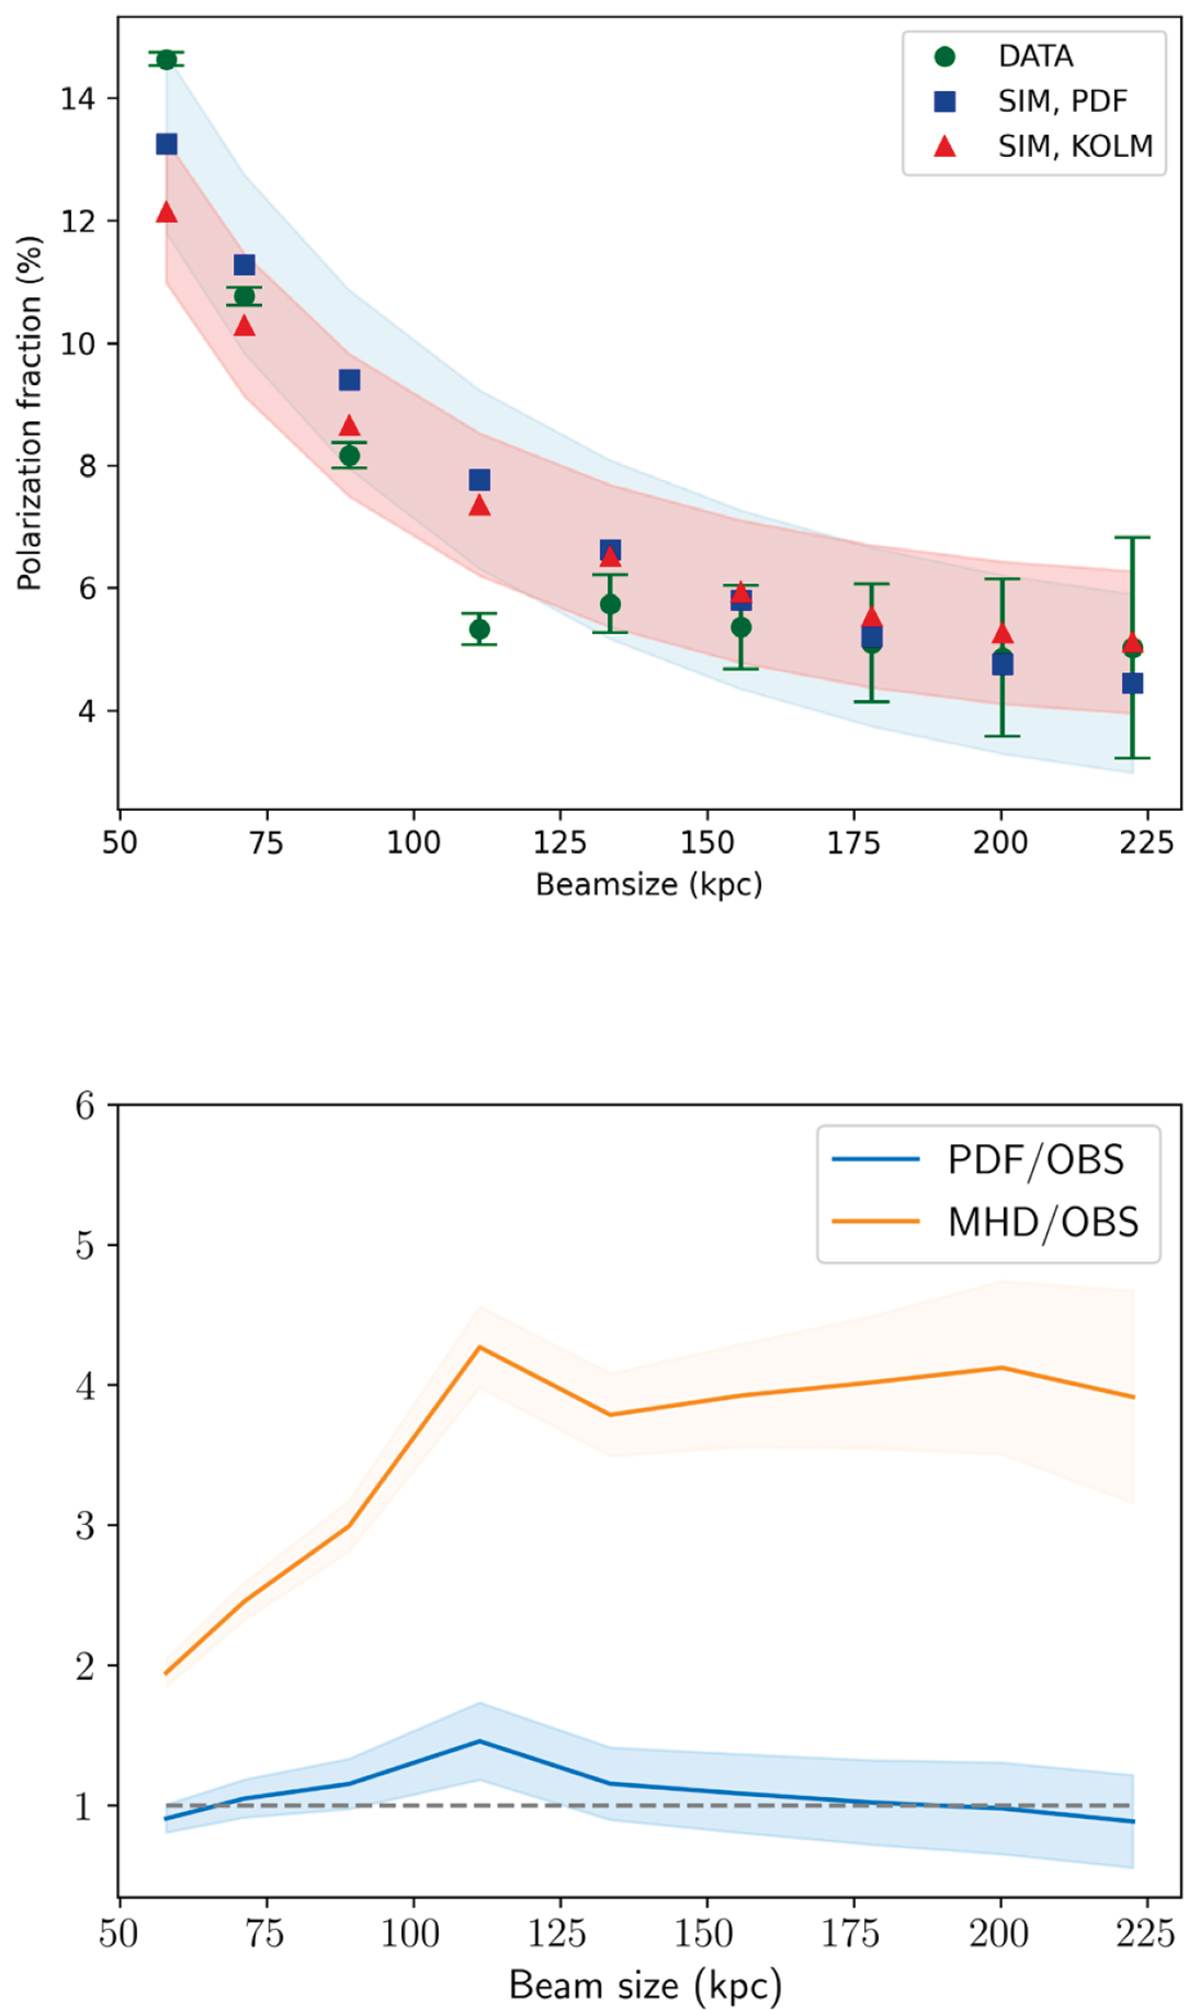
Fig. 9.
Download original image
Comparison between observed and simulated polarization trends with beam size. Top panel: Observed depolarization trend with the beam size (green circles) compared with the best-fit models for both the Kolmogorov (red triangles) and PDF (blue squares) magnetic field power spectrum (Sect. 5.3) Bottom panel: Comparison between the simulated depolarization trends normalized for the observed one. The best-fit PDF magnetic field power spectrum found in Sect. 5.3 is in blue, while the magnetic field from MHD simulations is in orange. The dashed, horizontal gray line represents the perfect coincidence between simulation and observational trends.
Current usage metrics show cumulative count of Article Views (full-text article views including HTML views, PDF and ePub downloads, according to the available data) and Abstracts Views on Vision4Press platform.
Data correspond to usage on the plateform after 2015. The current usage metrics is available 48-96 hours after online publication and is updated daily on week days.
Initial download of the metrics may take a while.