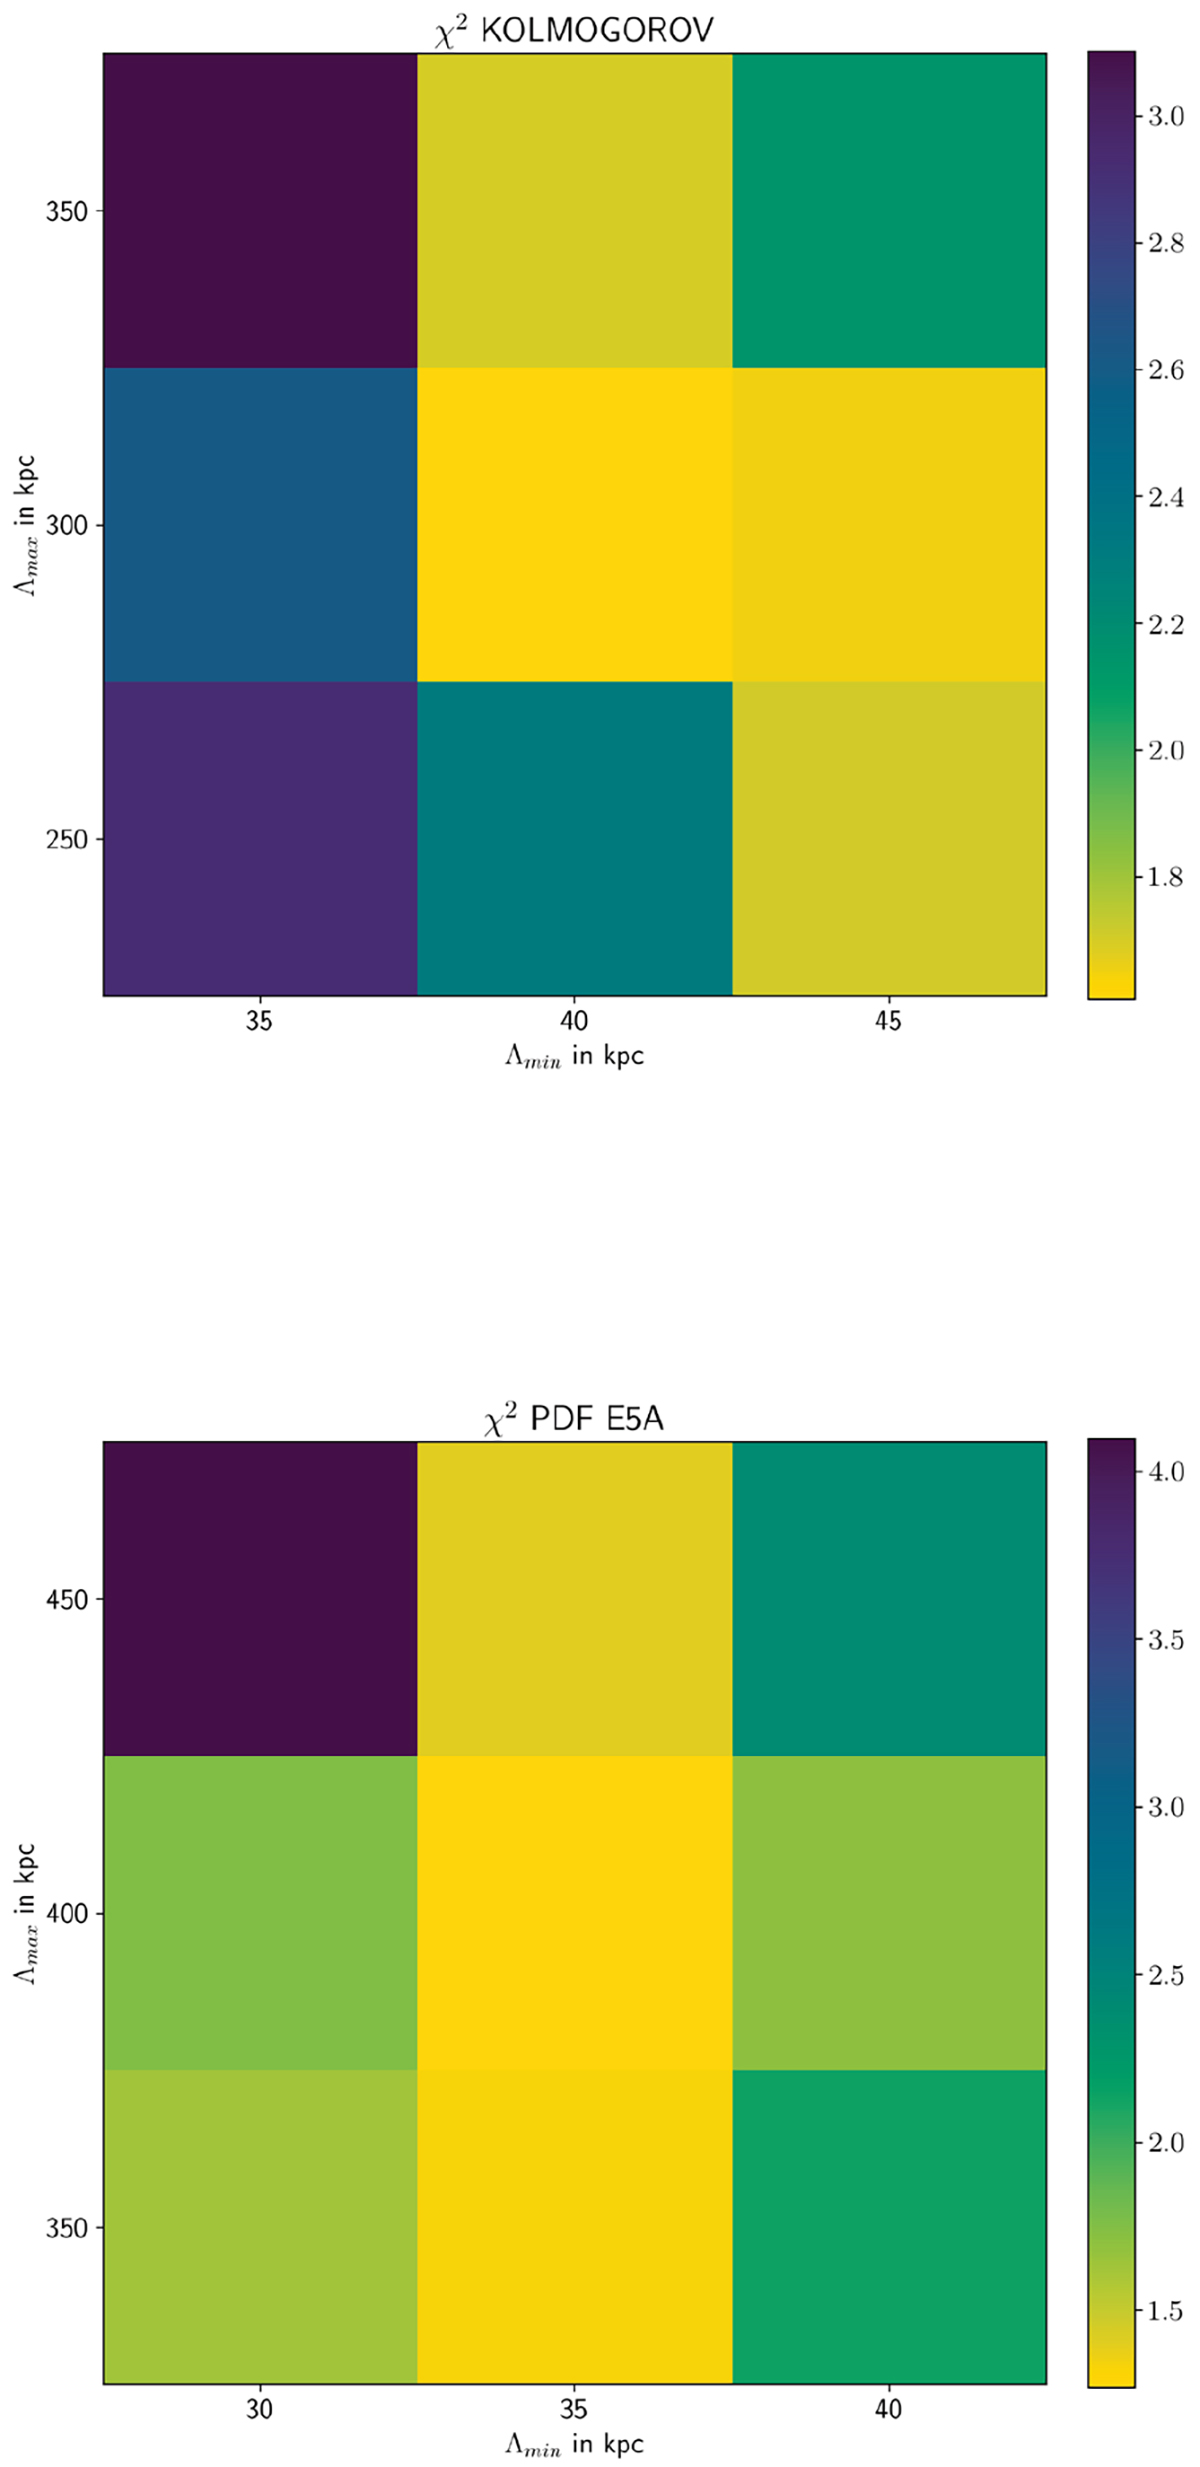
Fig. 8.
Download original image
Comparison between the reduced chi-squared values obtained for the two magnetic field power spectra selected for this work. The two axes represent the minimum and maximum scales in kpc over which the spectra were defined. On a color scale, we have the reduced chi-squared evaluated following Eq. (24). Top panel: For the Kolmogorov power spectrum. Bottom panel: For the PDF power spectrum.
Current usage metrics show cumulative count of Article Views (full-text article views including HTML views, PDF and ePub downloads, according to the available data) and Abstracts Views on Vision4Press platform.
Data correspond to usage on the plateform after 2015. The current usage metrics is available 48-96 hours after online publication and is updated daily on week days.
Initial download of the metrics may take a while.