Fig. 3.
Download original image
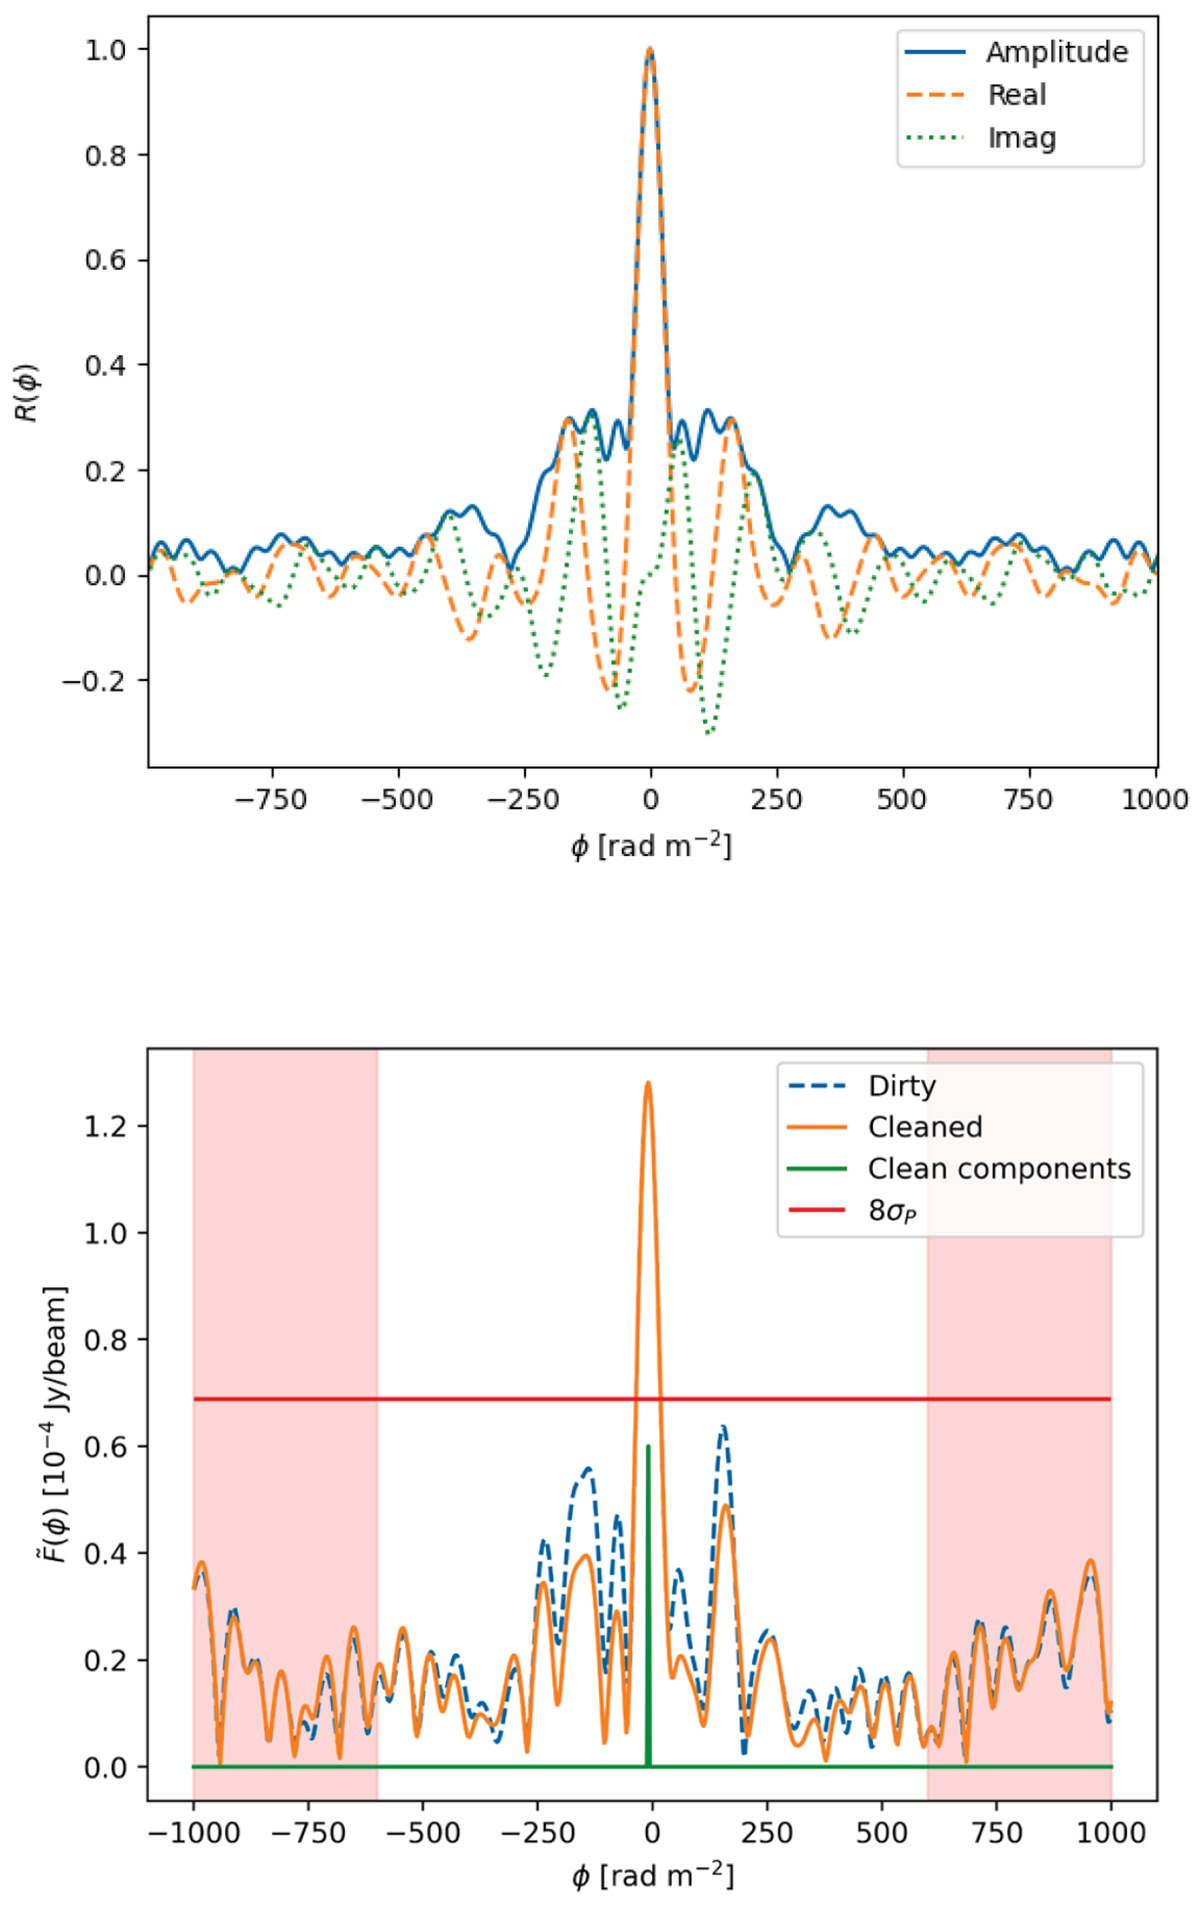
RM synthesis results. Top: RMSF for our observations. The dashed orange and dotted green lines represent the real and imaginary components, respectively, while the blue line shows the total amplitude. Bottom: Faraday spectrum for one pixel of the northern relic. We show here both the dirty (dashed blue line) and the cleaned (orange line) spectra. The horizontal red line represents the threshold used for RM clean, and in green we have the clean component selected by the cleaning algorithm. In light red we show the range of ϕ used to evaluate ![]() .
.
Current usage metrics show cumulative count of Article Views (full-text article views including HTML views, PDF and ePub downloads, according to the available data) and Abstracts Views on Vision4Press platform.
Data correspond to usage on the plateform after 2015. The current usage metrics is available 48-96 hours after online publication and is updated daily on week days.
Initial download of the metrics may take a while.