Open Access
Fig. 9
Download original image
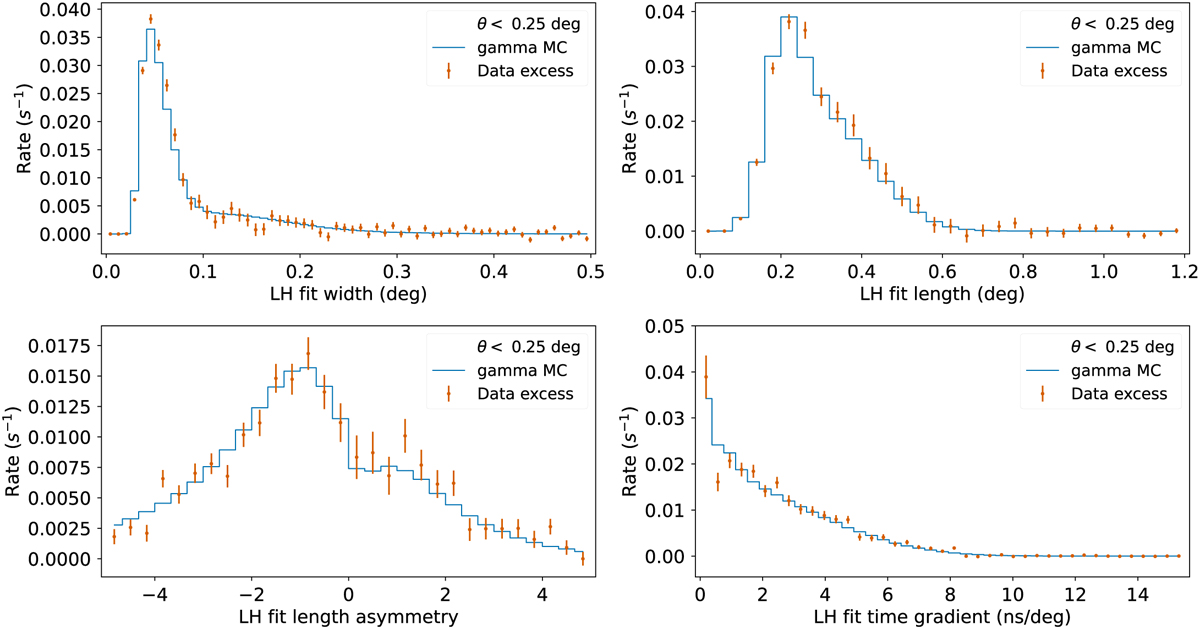
Comparison of the model parameters’ distribution between excess events from Crab Nebula observation and simulated gamma events with an energy distribution following the Crab Nebula spectrum. Four model parameters’ distribution for image intensities between 800 and 3200 p.e. are shown.
Current usage metrics show cumulative count of Article Views (full-text article views including HTML views, PDF and ePub downloads, according to the available data) and Abstracts Views on Vision4Press platform.
Data correspond to usage on the plateform after 2015. The current usage metrics is available 48-96 hours after online publication and is updated daily on week days.
Initial download of the metrics may take a while.