Fig. 2
Download original image
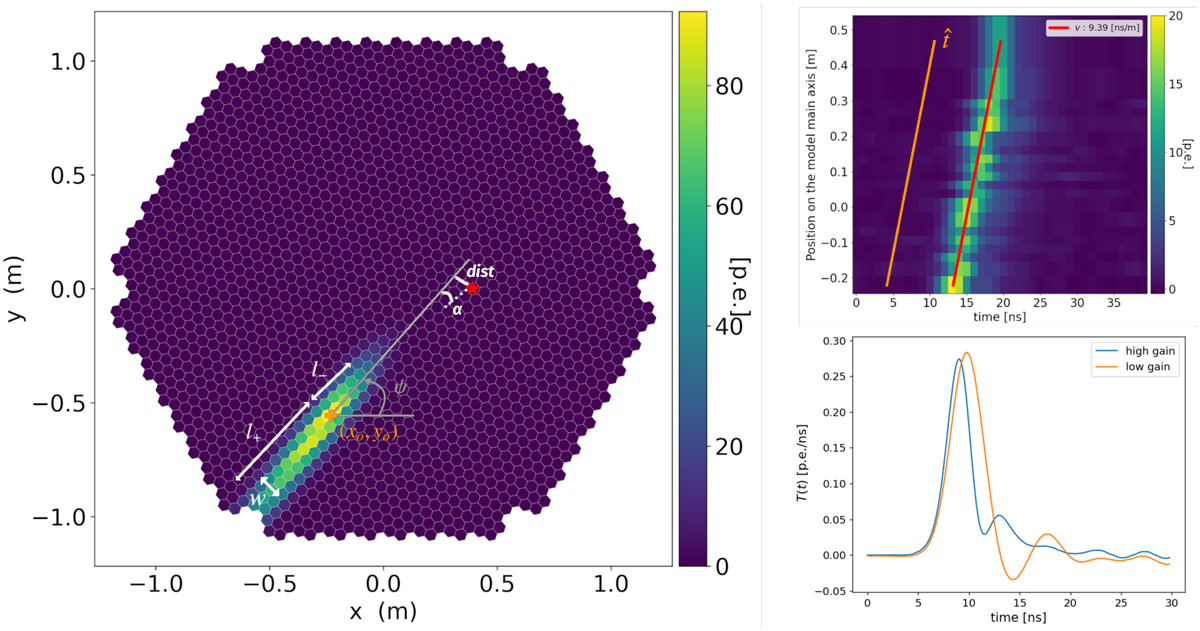
Model description. Left: 2D asymmetric Gaussian spatial model obtained after fitting the full model to an MC gamma-ray event. The red star is the position of the gamma-ray source in the camera. Spatial model parameters, and source-dependent analysis parameters (α and dist), are also shown. Top right: waveform amplitude distribution as a function of time and of the position along the fit main axis in the same event. The orange line represents the linear shift between the time of arrival of the signal at different positions along the shower main axis given by the temporal model. The red line is the same temporal model shifted to the maximum of the waveforms for illustration. Bottom right: template of the normalized pulsed response of a pixel to a single photo-electron in the two gain channels used by LST-1.
Current usage metrics show cumulative count of Article Views (full-text article views including HTML views, PDF and ePub downloads, according to the available data) and Abstracts Views on Vision4Press platform.
Data correspond to usage on the plateform after 2015. The current usage metrics is available 48-96 hours after online publication and is updated daily on week days.
Initial download of the metrics may take a while.