Fig. 17
Download original image
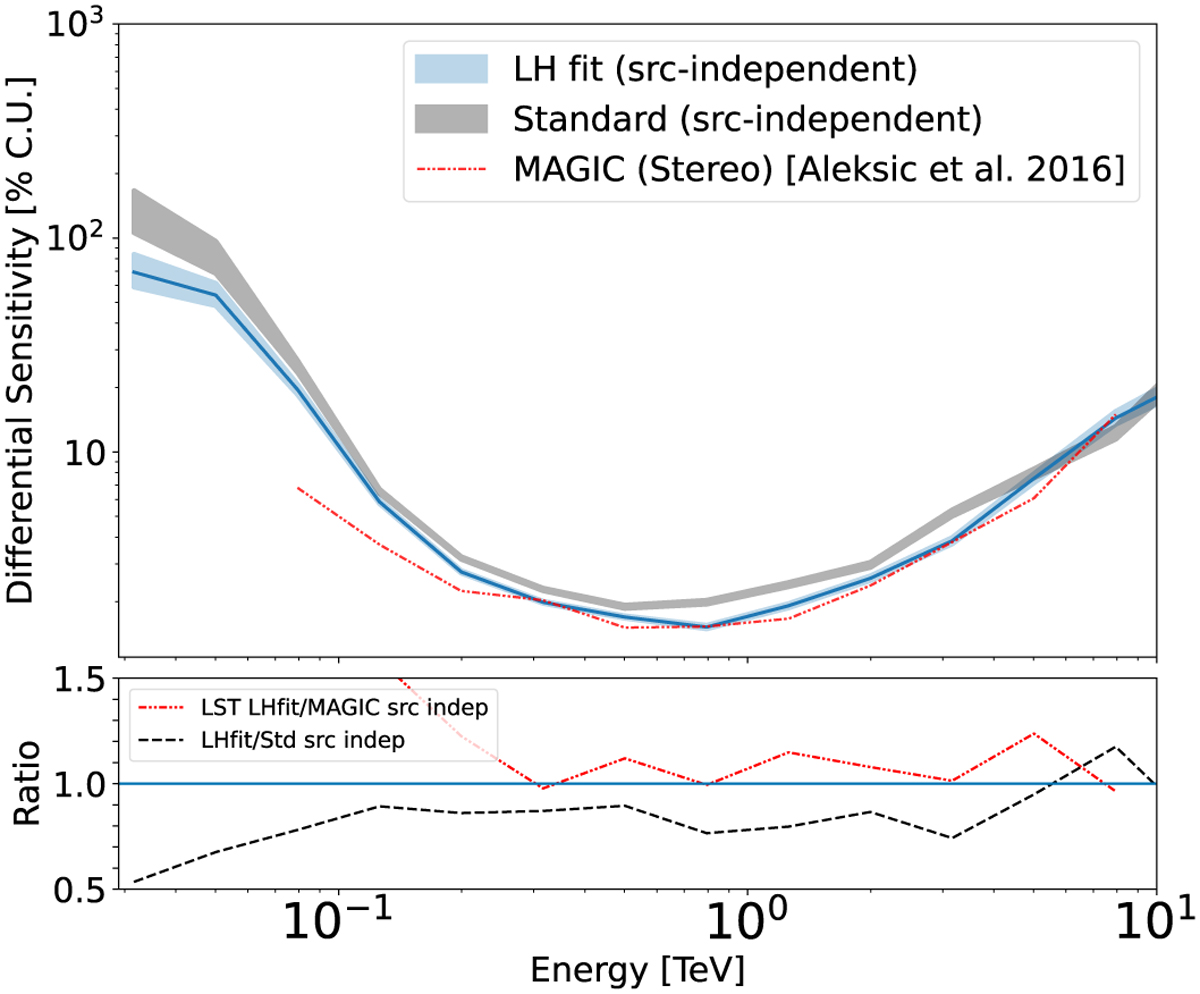
Differential sensitivity of LST-1 using the likelihood reconstruction method in percentage of the Crab Nebula flux. This was obtained from data by optimizing the gammaness and angular cuts for best sensitivity. The sensitivity shown here for the likelihood reconstruction, and associated statistical errors, are the average of the curves obtained through reversing the half of events used for cut optimization and sensitivity estimation. The “standard” sensitivity is from Abe et al. (2023).
Current usage metrics show cumulative count of Article Views (full-text article views including HTML views, PDF and ePub downloads, according to the available data) and Abstracts Views on Vision4Press platform.
Data correspond to usage on the plateform after 2015. The current usage metrics is available 48-96 hours after online publication and is updated daily on week days.
Initial download of the metrics may take a while.