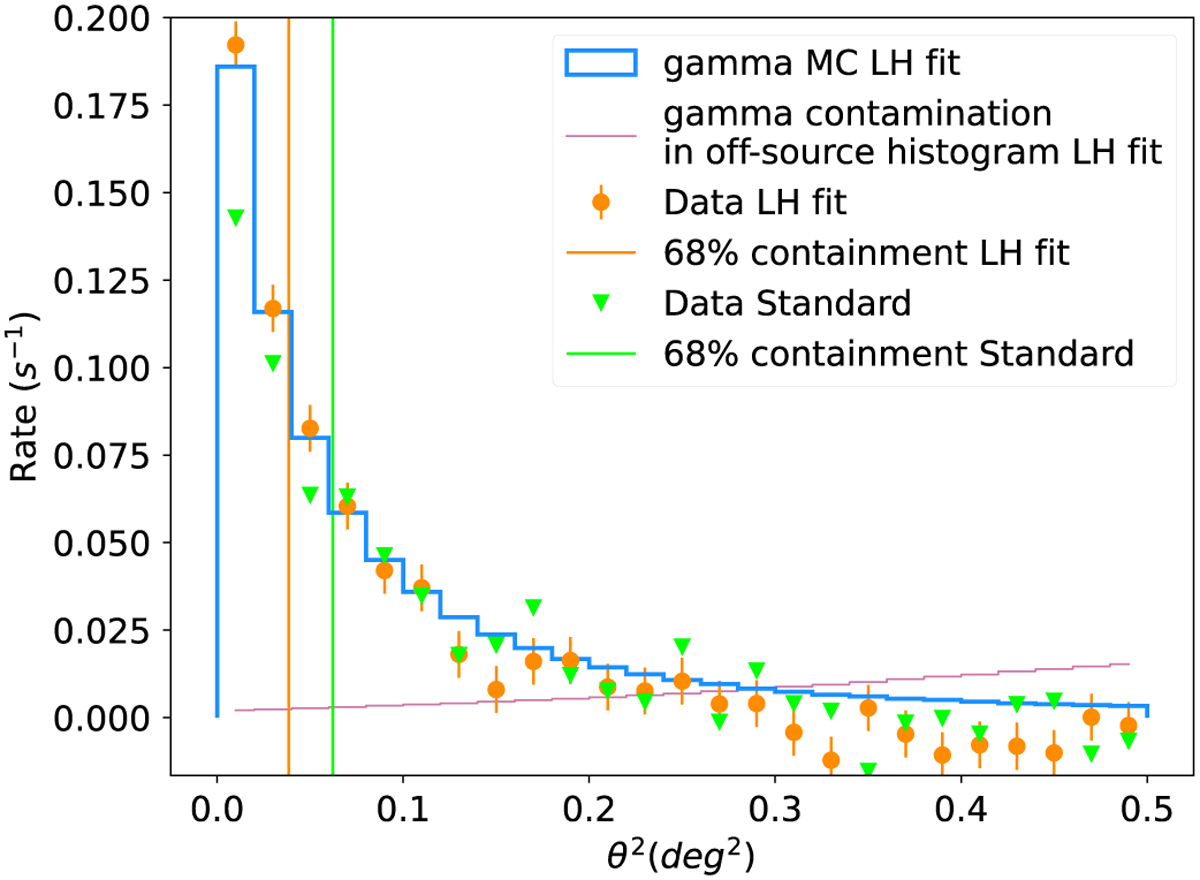
Fig. 16

Download original image
Distribution of the square angular distance between the source position and the reconstructed gamma-ray origin (θ2) for low intensity (80–200 p.e.) excess events. A good agreement is seen between data from Crab Nebula observations and expectations from MC simulation with the likelihood reconstruction. The same distribution for the standard reconstruction (from Abe et al. 2023) is also displayed. Vertical lines represent the 68% containment for both data distributions and show that the likelihood reconstruction reaches a better angular resolution.
Current usage metrics show cumulative count of Article Views (full-text article views including HTML views, PDF and ePub downloads, according to the available data) and Abstracts Views on Vision4Press platform.
Data correspond to usage on the plateform after 2015. The current usage metrics is available 48-96 hours after online publication and is updated daily on week days.
Initial download of the metrics may take a while.


