Fig. 14
Download original image
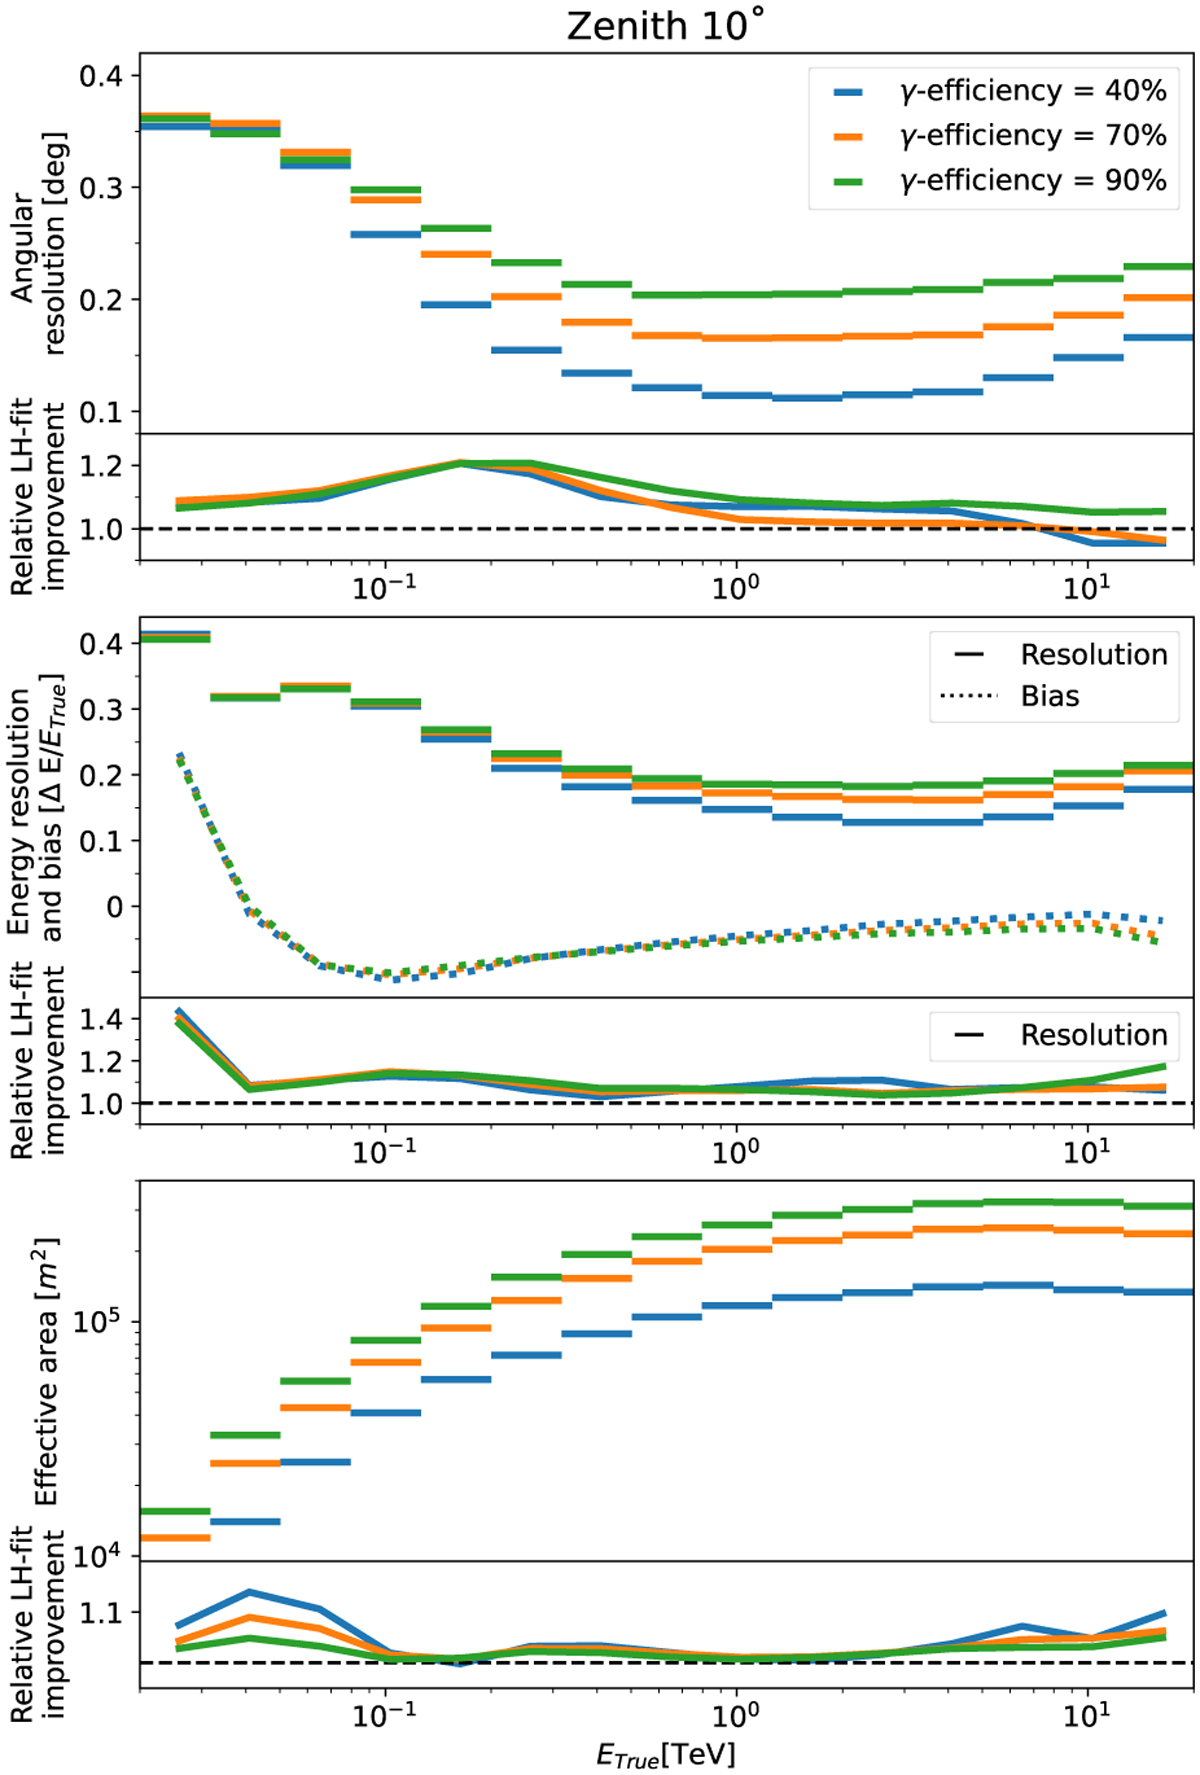
Performance of the likelihood reconstruction method at 10° from the zenith for three γ efficiencies. Each plot shows the LH fit performance in the top section and the relative improvement compared to the standard analysis, with performance evaluated in the exact same way, in the bottom section. Top: angular resolution (68% containment angle). Middle: energy resolution (68% relative containment) and bias (median shift). Bottom: effective area.
Current usage metrics show cumulative count of Article Views (full-text article views including HTML views, PDF and ePub downloads, according to the available data) and Abstracts Views on Vision4Press platform.
Data correspond to usage on the plateform after 2015. The current usage metrics is available 48-96 hours after online publication and is updated daily on week days.
Initial download of the metrics may take a while.