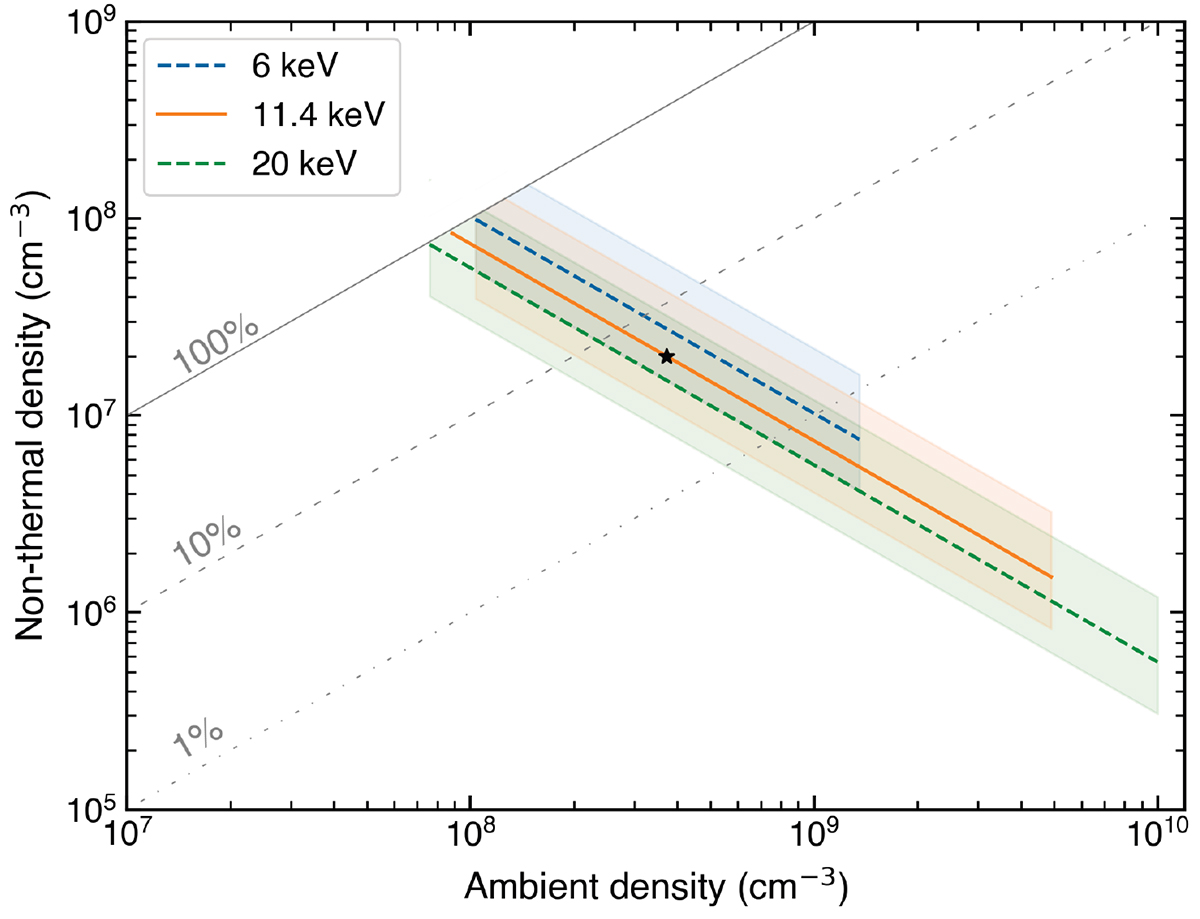
Fig. 8.
Download original image
Plot of the instantaneous non-thermal electron density as a function of ambient density for three different low-energy cut-offs. The non-thermal electron density is calculated and plotted only where the thin-target assumption is valid. The shaded regions mark the ranges of the estimated volume from the source size estimations. The grey lines at 100%, 10%, and 1% mark where the ambient density equals the respective percentages of the non-thermal density (i.e. 100% is the extreme cases when the ambient density equals the non-thermal electron density.) The black star marks the value of the instantaneous non-thermal electron density if we assume the ambient density is that of the thermal source.
Current usage metrics show cumulative count of Article Views (full-text article views including HTML views, PDF and ePub downloads, according to the available data) and Abstracts Views on Vision4Press platform.
Data correspond to usage on the plateform after 2015. The current usage metrics is available 48-96 hours after online publication and is updated daily on week days.
Initial download of the metrics may take a while.