Fig. 5.
Download original image
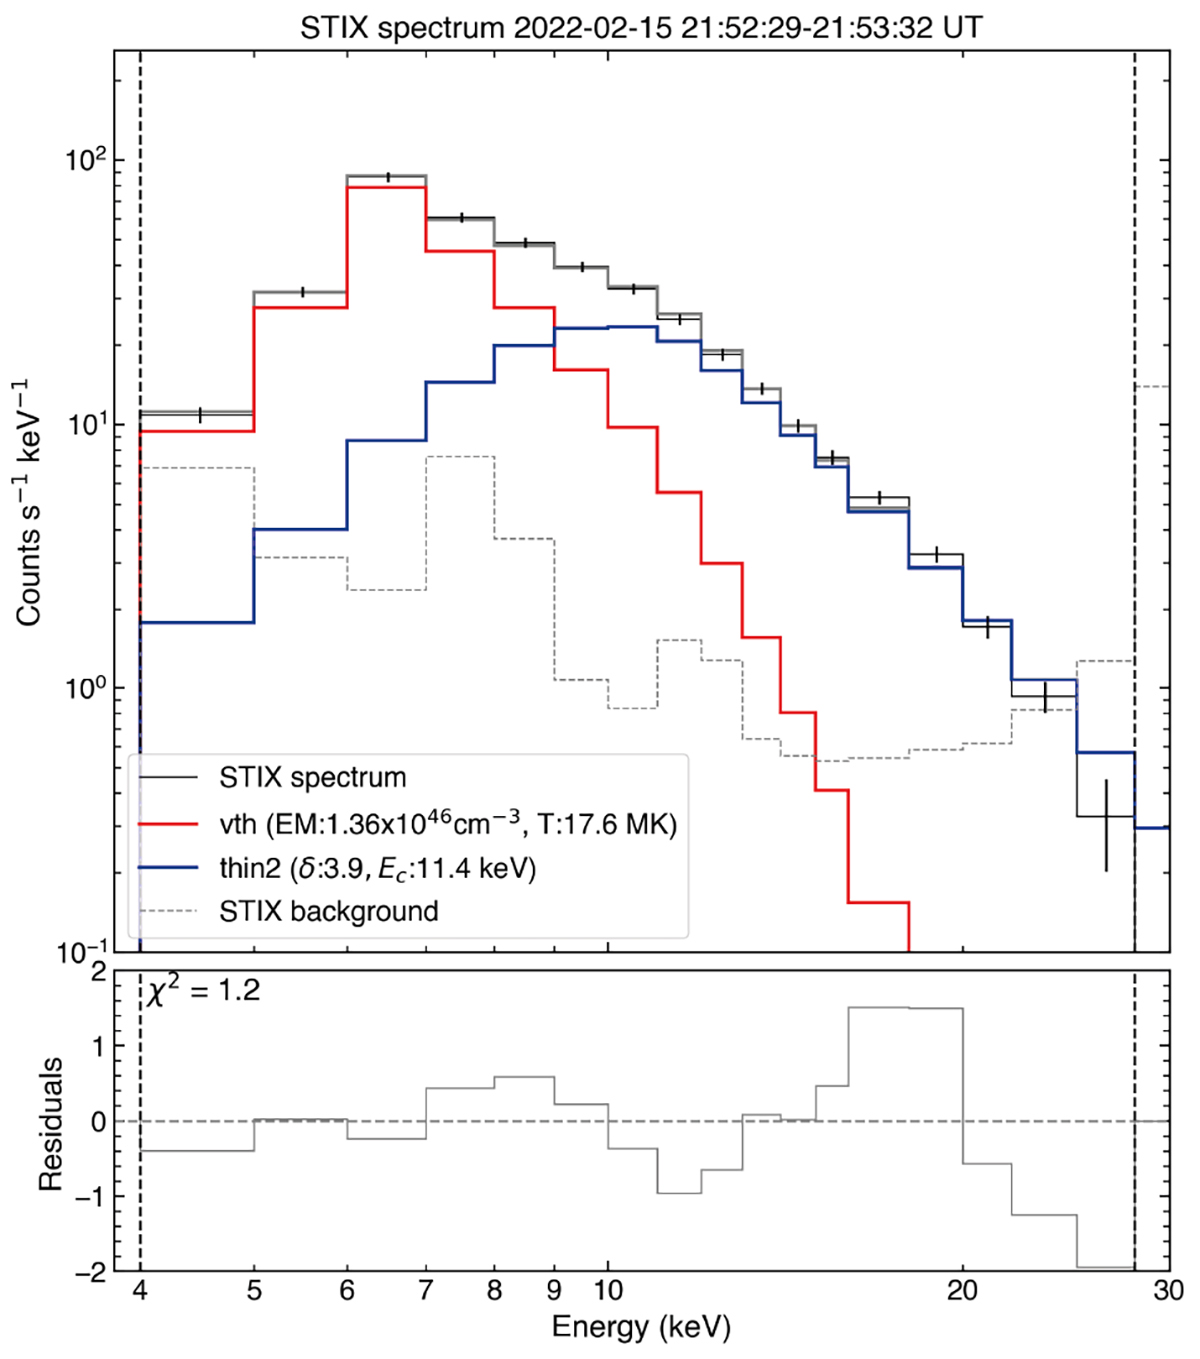
STIX background-subtracted X-ray count flux spectra (black) over the peak of the X-ray emission, and the fitting results. The isothermal fit is plotted in red, and the non-thermal thin-target model is plotted in blue. Below the spectrum are the residuals of the fit to the data. The vertical dashed lines mark the energy range over which the spectral fit was performed.
Current usage metrics show cumulative count of Article Views (full-text article views including HTML views, PDF and ePub downloads, according to the available data) and Abstracts Views on Vision4Press platform.
Data correspond to usage on the plateform after 2015. The current usage metrics is available 48-96 hours after online publication and is updated daily on week days.
Initial download of the metrics may take a while.