Fig. 4.
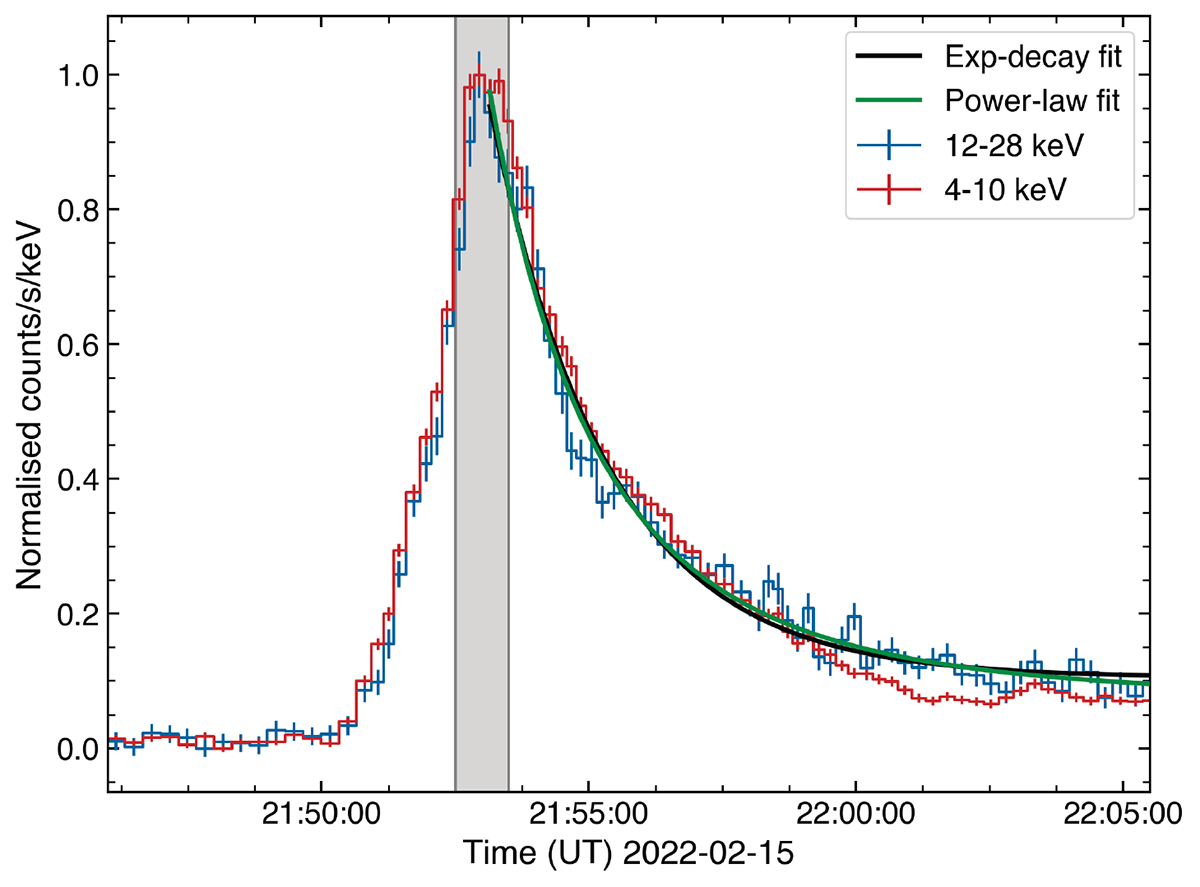
Download original image
STIX 4–10 keV and 12–28 keV time series (normalised). The grey shaded region marks the time interval over which the spectral fitting was performed. The black curve shows the exponential-decay fitted to the decay.
Current usage metrics show cumulative count of Article Views (full-text article views including HTML views, PDF and ePub downloads, according to the available data) and Abstracts Views on Vision4Press platform.
Data correspond to usage on the plateform after 2015. The current usage metrics is available 48-96 hours after online publication and is updated daily on week days.
Initial download of the metrics may take a while.