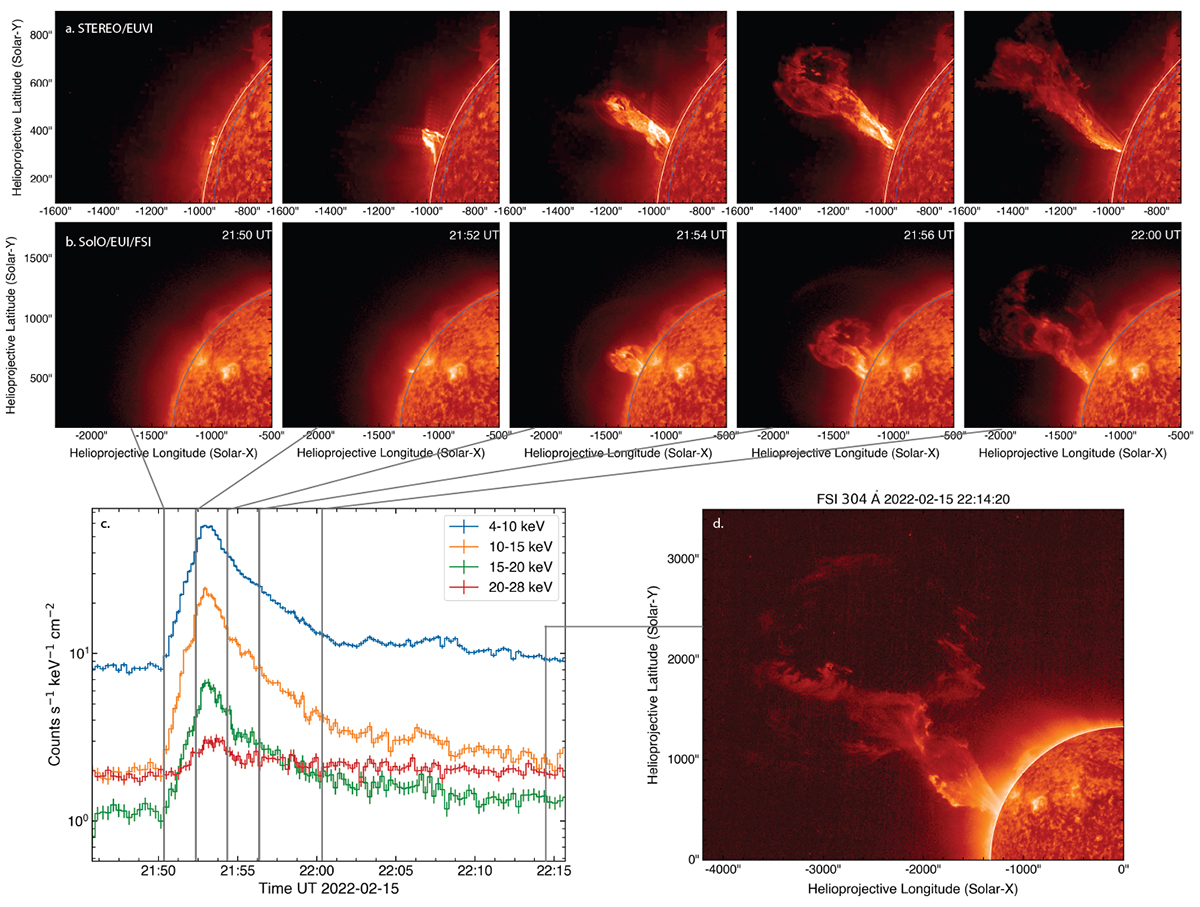
Fig. 3.
Download original image
Overview of the EUV observations in 304 Å from the different vantage points of STEREO/EUVI and Solar Orbiter/EUI/FSI. Panel (a) and panel (b) show five consecutive images from EUVI and FSI, respectively. The images of EUVI and EUI are matched to the closest time, taking light-travel time into account, and are given in the time at Solar Orbiter. They are not re-projected to one viewpoint; the maps are plotted from their respective vantage points, and hence the arcsec scales are different. The grey line in panel a shows the solar limb as viewed from Solar Orbiter. In panel (c), the STIX light curves are plotted with the five vertical lines corresponding to the five EUV images plotted in (a) and (b). In panel (d) the EUV filament eruption is shown at a later time when the X-ray emission has ceased.
Current usage metrics show cumulative count of Article Views (full-text article views including HTML views, PDF and ePub downloads, according to the available data) and Abstracts Views on Vision4Press platform.
Data correspond to usage on the plateform after 2015. The current usage metrics is available 48-96 hours after online publication and is updated daily on week days.
Initial download of the metrics may take a while.