Fig. 2.
Download original image
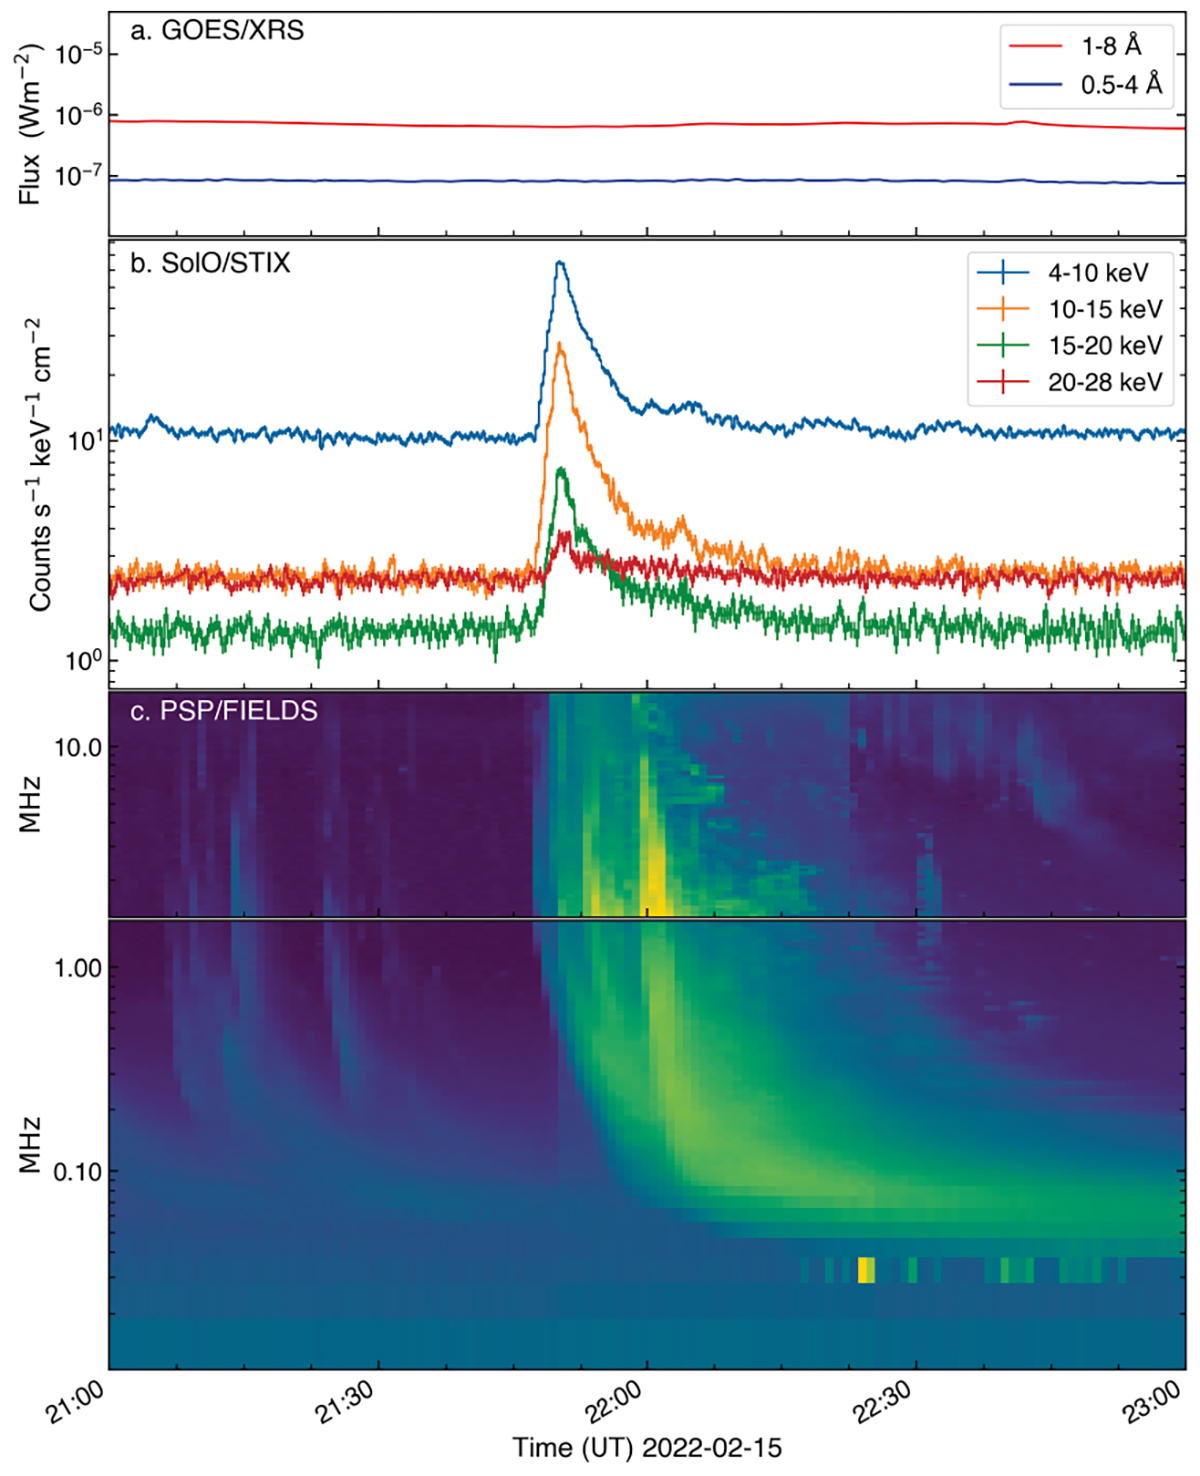
X-ray and radio observations of the eruption as observed by Earth, Solar Orbiter, and PSP. The GOES XRS 1–8 Å and 0.5–4 Å channels are shown in panel a. The STIX light curves in four energy bands (flux summed over these energies) are shown in panel (b), where X-ray emission associated with the eruption can be seen clearly. In panel (c), the dynamic spectra observed by HFR and LFR from PSP/FIELDS are plotted, where the Type-III radio bursts associated with the event is observed. Langmuir waves are also observed at ∼0.05 MHz after around 22:20 UT. The times here are all adjusted to UT at the PSP location.
Current usage metrics show cumulative count of Article Views (full-text article views including HTML views, PDF and ePub downloads, according to the available data) and Abstracts Views on Vision4Press platform.
Data correspond to usage on the plateform after 2015. The current usage metrics is available 48-96 hours after online publication and is updated daily on week days.
Initial download of the metrics may take a while.