Fig. E.2
Download original image
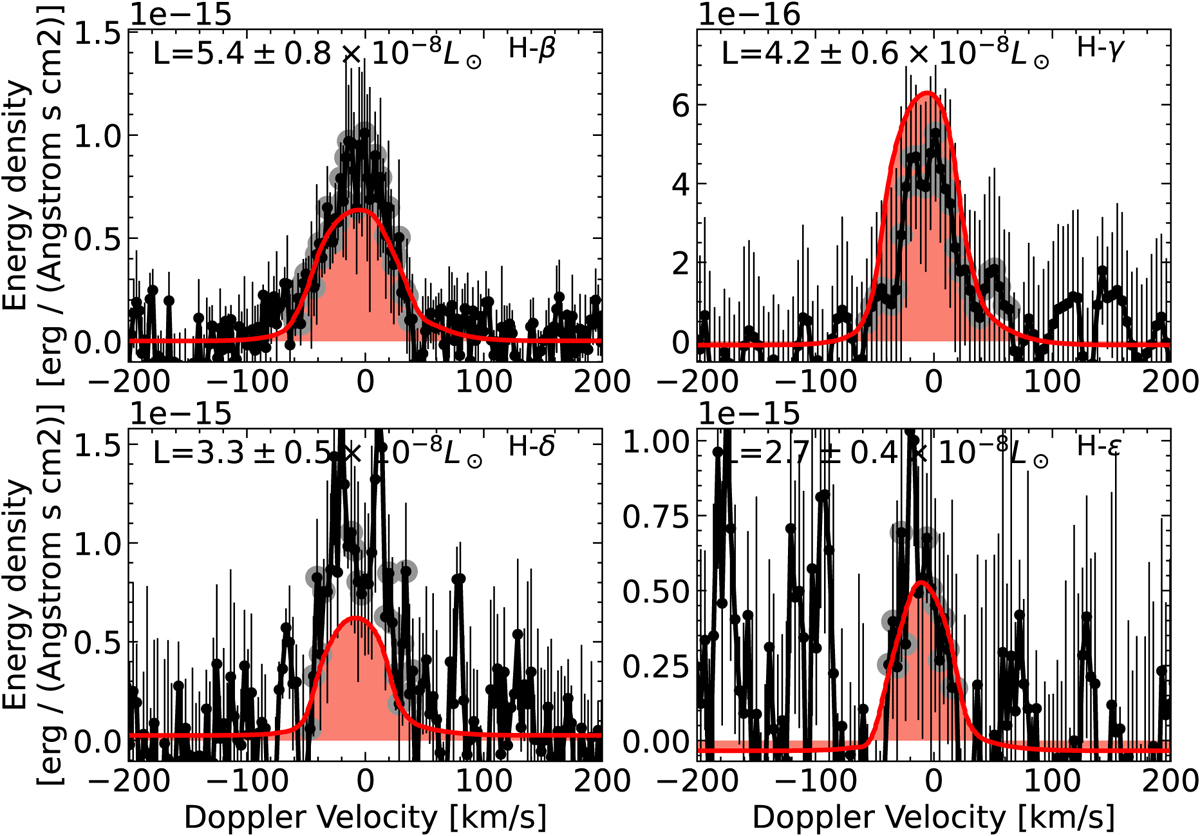
The SED with Aoyama et al. (2020, 2021) model corresponding to ![]() that fits all the line profiles (H4–H7) reasonably well. The y-axis represents the measured flux density and the x-axis represents the velocity shift with respect to the rest wavelength of the line. The solid black curve represents the observed data, and the red curve represents the model prediction. The black vertical lines are the uncertainties in the observed flux, and the grey filled circles are the points along the observed profile the model was fitted to. The model-predicted luminosity from each line is also indicated in the figure.
that fits all the line profiles (H4–H7) reasonably well. The y-axis represents the measured flux density and the x-axis represents the velocity shift with respect to the rest wavelength of the line. The solid black curve represents the observed data, and the red curve represents the model prediction. The black vertical lines are the uncertainties in the observed flux, and the grey filled circles are the points along the observed profile the model was fitted to. The model-predicted luminosity from each line is also indicated in the figure.
Current usage metrics show cumulative count of Article Views (full-text article views including HTML views, PDF and ePub downloads, according to the available data) and Abstracts Views on Vision4Press platform.
Data correspond to usage on the plateform after 2015. The current usage metrics is available 48-96 hours after online publication and is updated daily on week days.
Initial download of the metrics may take a while.