Open Access
Fig. D.2
Download original image
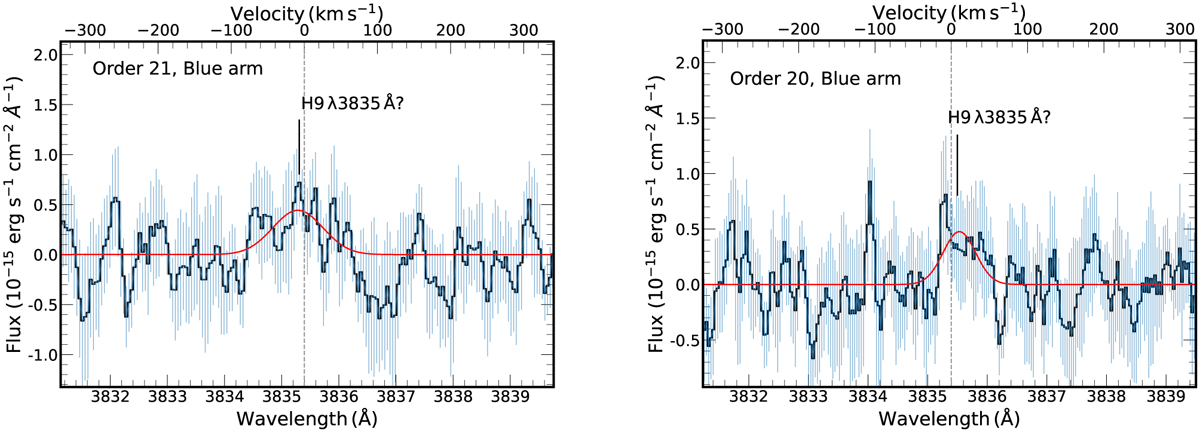
The flux increase detected at the location of H9 in (Left) order 21, and (Right) order 20 of the blue arm of UVES in the 2M1115 data, at 1.7σ and 1.9σ respectively. Colours and symbols hold the same meaning as in the previous figure.
Current usage metrics show cumulative count of Article Views (full-text article views including HTML views, PDF and ePub downloads, according to the available data) and Abstracts Views on Vision4Press platform.
Data correspond to usage on the plateform after 2015. The current usage metrics is available 48-96 hours after online publication and is updated daily on week days.
Initial download of the metrics may take a while.