Fig. D.1
Download original image
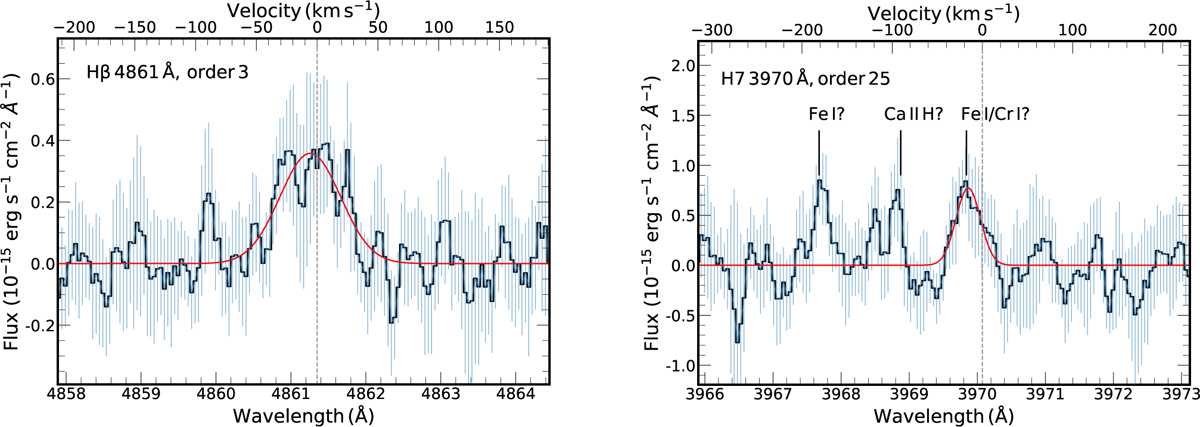
(Left) Hß detected at 4.3σ- in order 3 of the redL arm, and (Right) H7 line detected at 3.6σ in order 25 of the blue arm of UVES in the 2M1115 data. The red curve indicates the Gaussian fit to the observed flux (blue curve). The blue vertical lines indicate the uncertainty in the flux. The tentatively detected Ca II H (3968.47 Å) at 3.1σ and Fe I (3967.42 Å) at 3.2σ next to H7 are also indicated in the figure.
Current usage metrics show cumulative count of Article Views (full-text article views including HTML views, PDF and ePub downloads, according to the available data) and Abstracts Views on Vision4Press platform.
Data correspond to usage on the plateform after 2015. The current usage metrics is available 48-96 hours after online publication and is updated daily on week days.
Initial download of the metrics may take a while.