Fig. E.2
Download original image
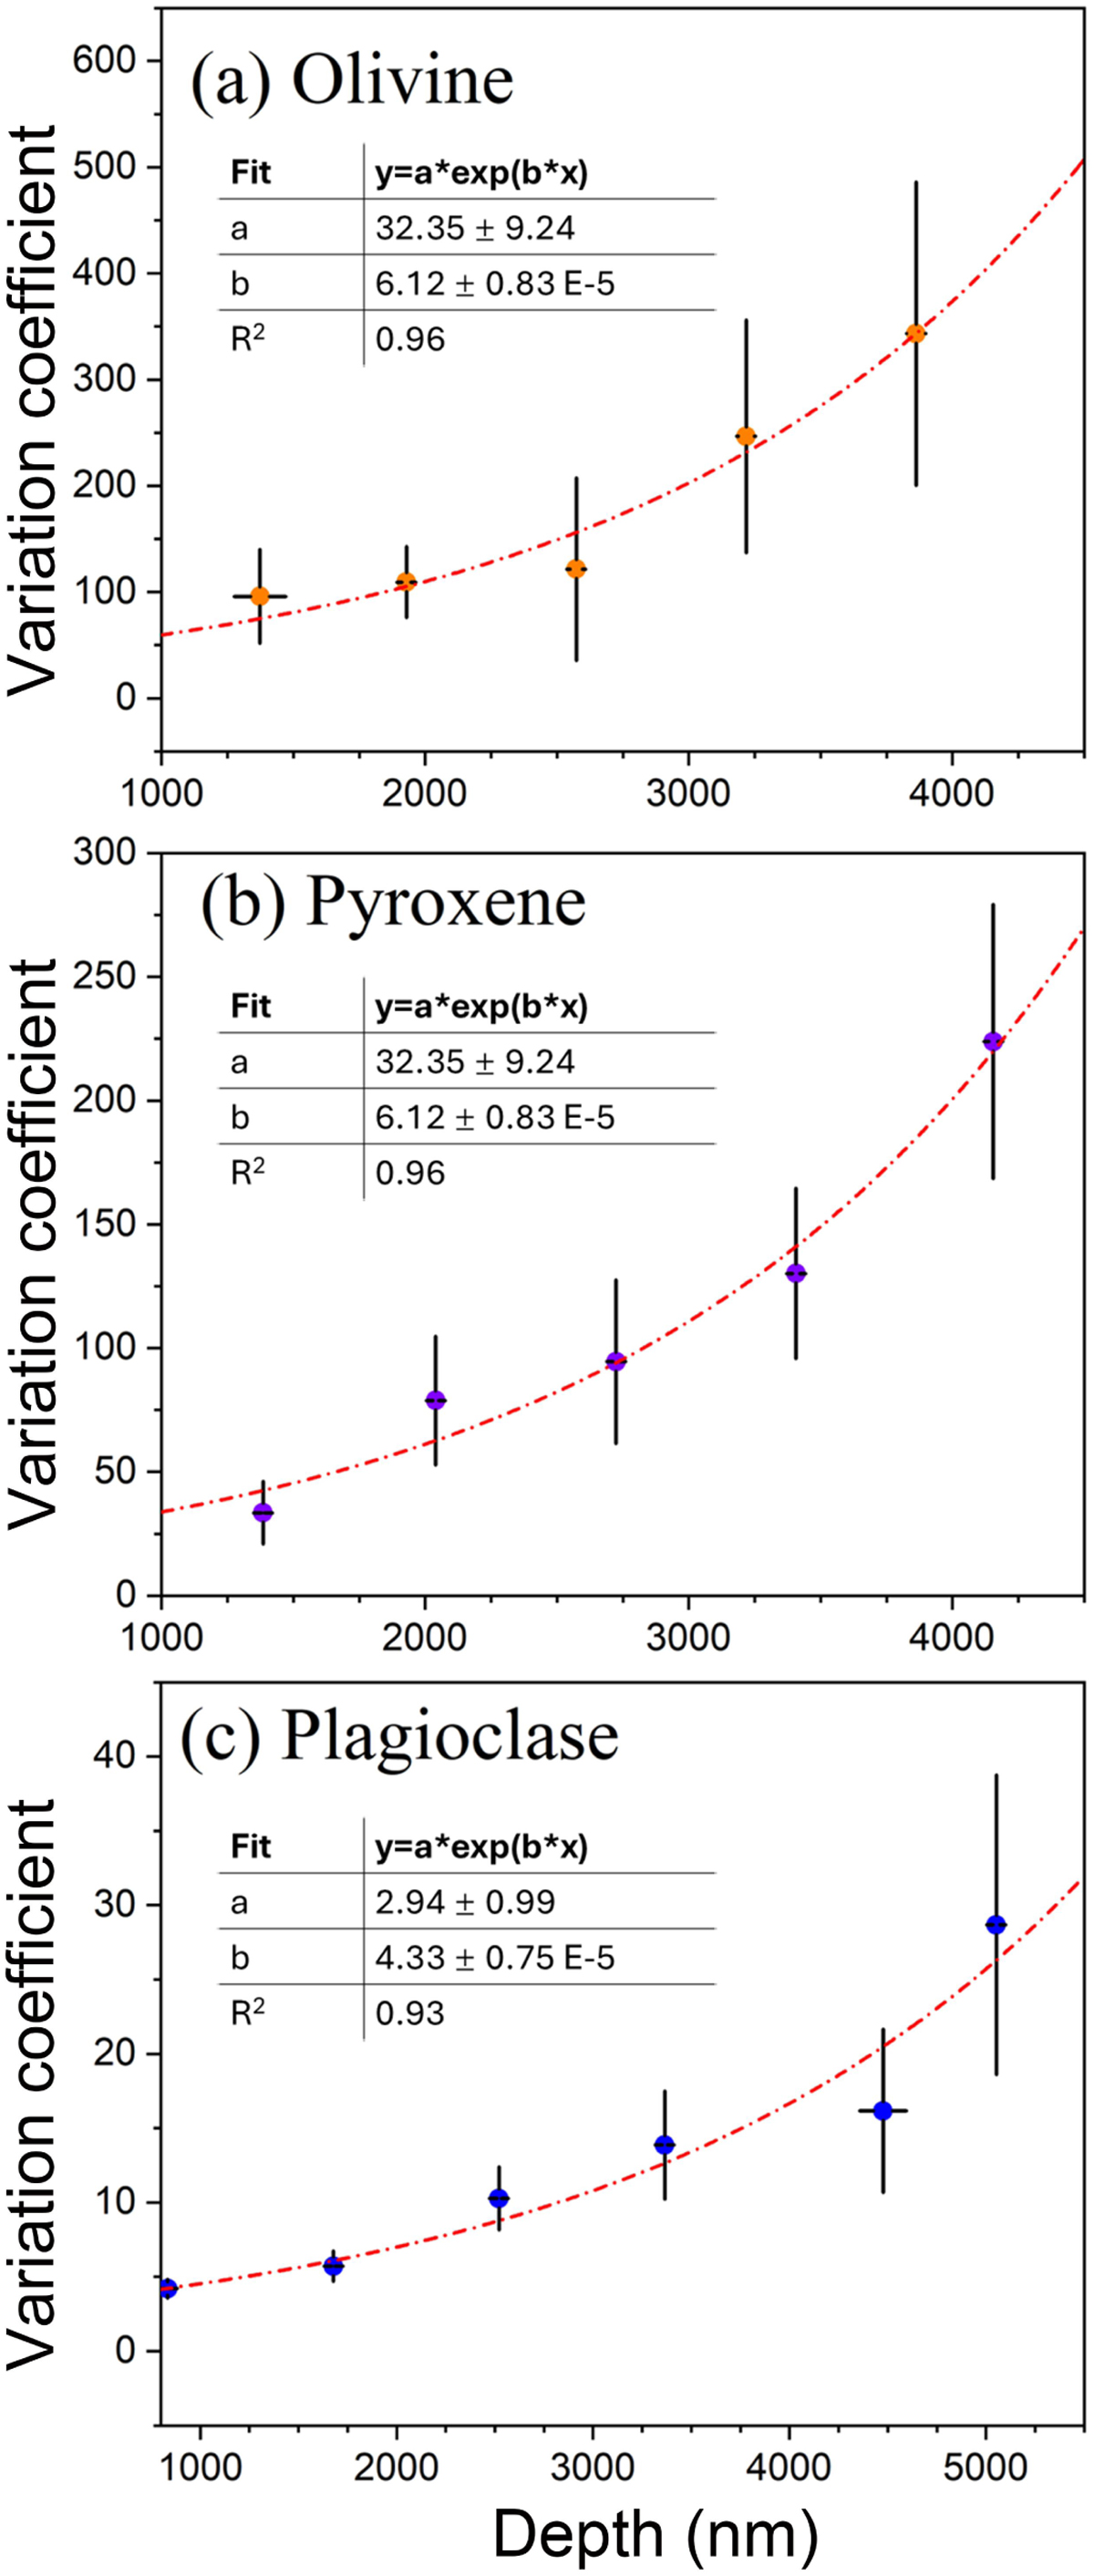
Variation coefficient between the front and back analysis data calculated using the following formula: (D/18O(front) )/( D/18O(back)). (a) Olivine. (b) Pyroxene. (c) Plagioclase. Both the front and back data exhibited a diffusion feature that increased with depth. Thus, the variation trend of the coefficient follows an exponential function. For olivine, pyroxene, and plagioclase, three distinct calibration curves were produced through exponential fitting. Utilising these three sets of equations allows for the effective removal of influence of D particle re-deposition during the deep NanoSIMS analysis from the original D/16O data.
Current usage metrics show cumulative count of Article Views (full-text article views including HTML views, PDF and ePub downloads, according to the available data) and Abstracts Views on Vision4Press platform.
Data correspond to usage on the plateform after 2015. The current usage metrics is available 48-96 hours after online publication and is updated daily on week days.
Initial download of the metrics may take a while.