Fig. 2
Download original image
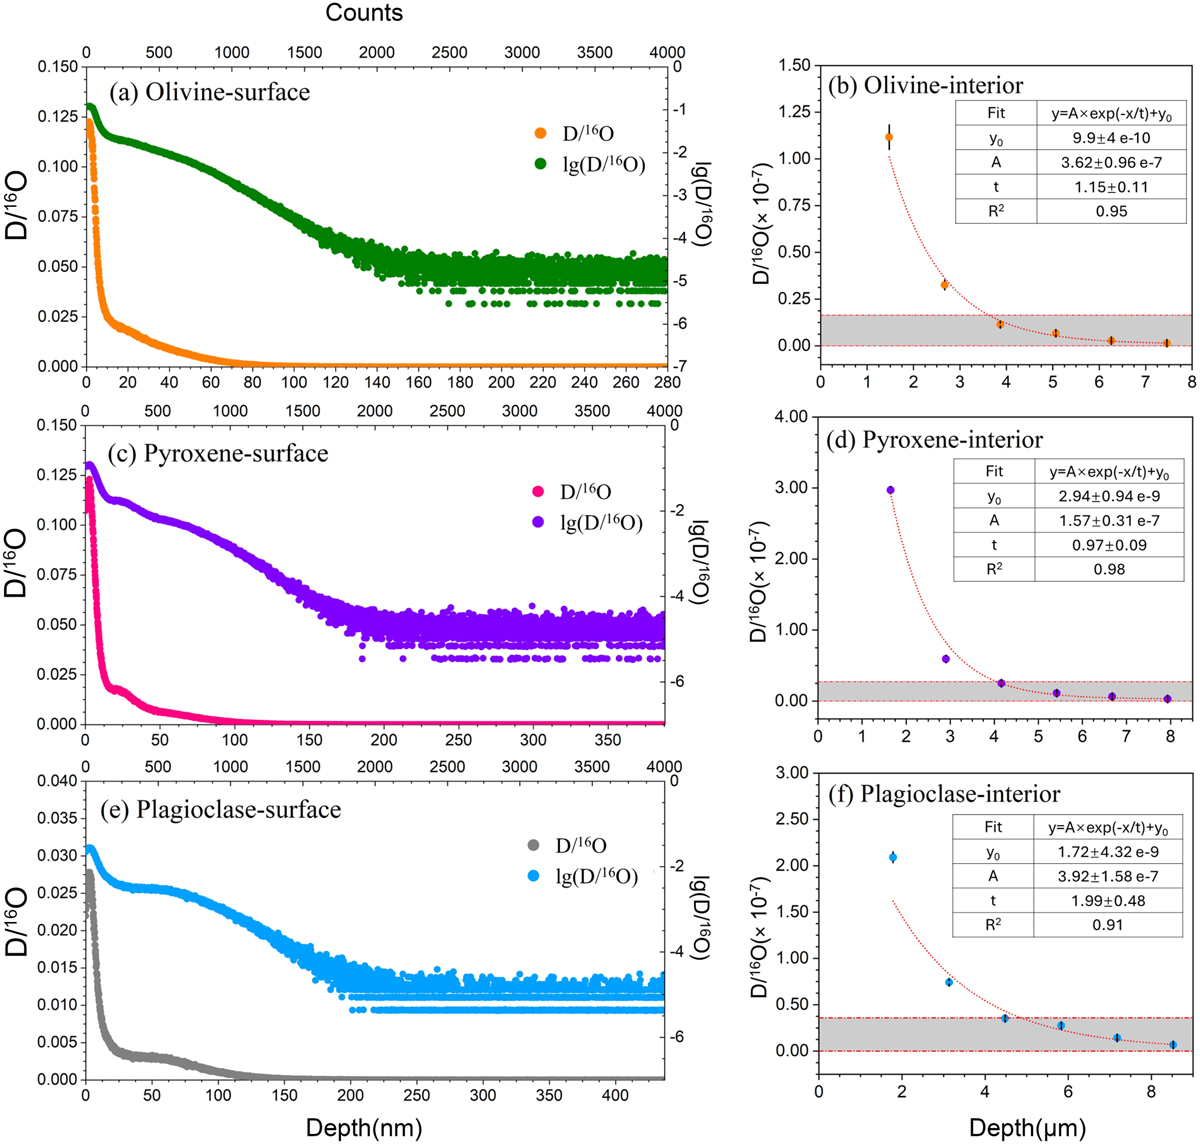
Depth profiles of the D/16O ratio determined using NanoSIMS for D-irradiated samples on the surface (a, c, and e) and in the interior (b, d, and, f). Depth measurement methods and interior data calibration methods are described in Appendices D and E. The upper x-axis gives the raster cycle number, and the lower x-axis the depths according to the NanoSIMS analysis pits. Each data point in panels a, c, and e corresponds to one cycle at one depth. Each data point in panels b, d, and f is the sum analysis result of 160 cycles. The grey region in panels b, d, and f represents the D/16O ratio of backgrounds for each mineral (less than 9.7 ± 6.8 × 10⁻⁹ for olivine; less than 1.9 ± 0.8 × 10⁻⁸ for pyroxene; and less than 2.3 ± 1.3 × 10⁻⁸ for plagioclase). The error bars represent the standard error of the mean. The dashed red line in panels b, d, and f represents the fitting curve for the decreasing trend of D/16O. The intersection of the fitting curve with the background value for each silicate indicates the deepest penetration of implanted D: 3619 ± 112 nm in olivine, 4049 ± 50 nm in pyroxene, and 4855 ± 263 nm in plagioclase.
Current usage metrics show cumulative count of Article Views (full-text article views including HTML views, PDF and ePub downloads, according to the available data) and Abstracts Views on Vision4Press platform.
Data correspond to usage on the plateform after 2015. The current usage metrics is available 48-96 hours after online publication and is updated daily on week days.
Initial download of the metrics may take a while.