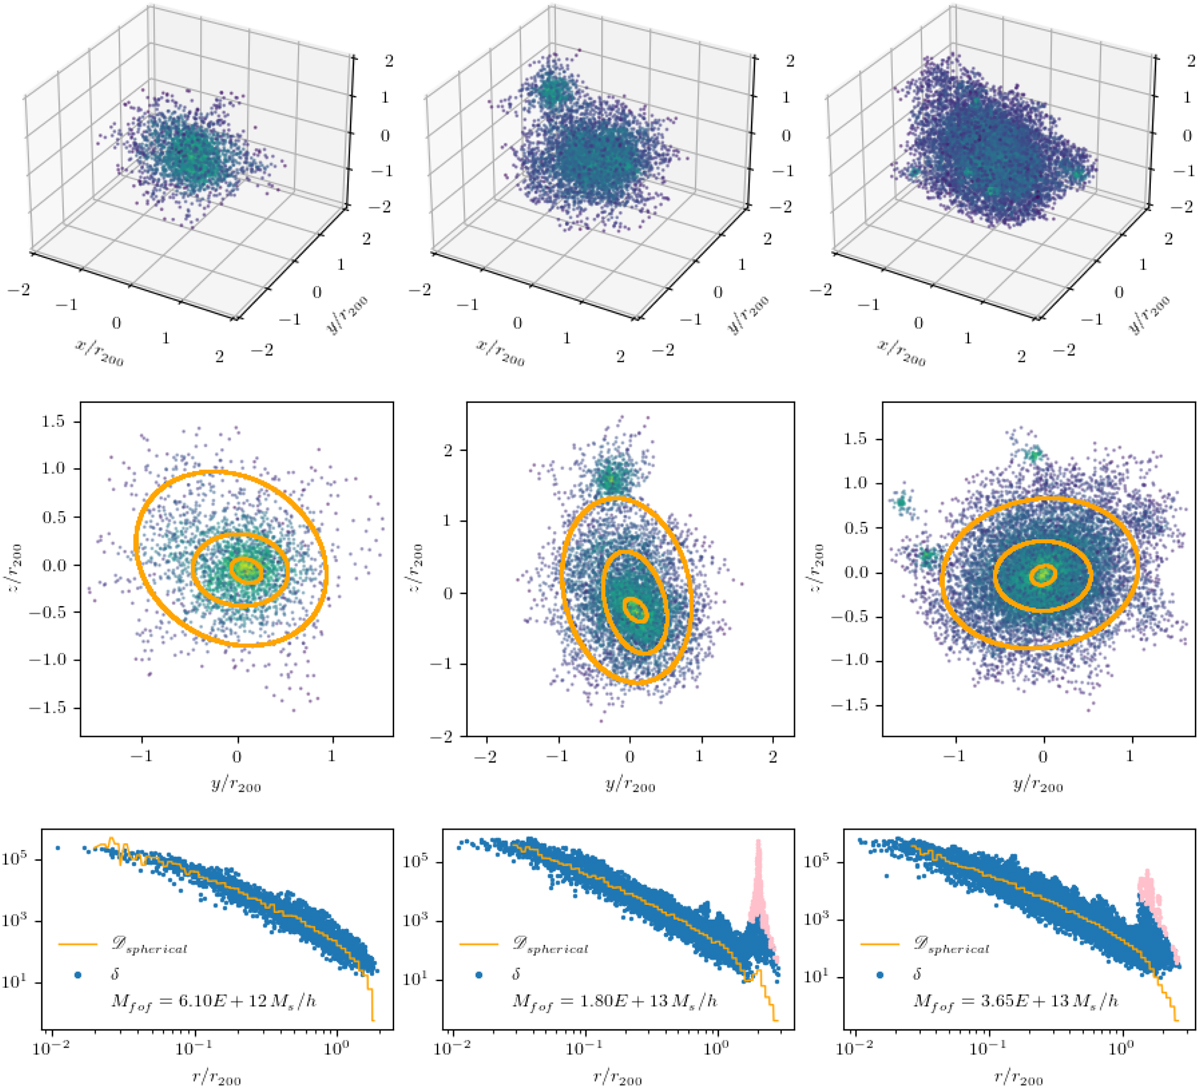
Fig. 3
Download original image
Three DM halos with three various numbers of particles (the particle mass is equal to 2.1 · 109 M⊙/h) in ΛCDM Dark Energy Universe Simulations. Their mass is respectively from left to right 6.1 · 1012, 1.8 · 1013, 3.65 · 1013 M⊙/h. The first line of this figure shows the three-dimensional representations of the halos: each halo contains numerous substructures, mainly located at the periphery; their number increases with the mass of the halo. The second line shows the ellipsoids corresponding at best to the δ = 200, δ = 2000 and δ = 20 000 isodensities, superimposed on the particles in the (y, z) plane. The graphs in the third row show the point clouds in the (r, δ) plane, where each point represents a particle located at a distance r from the center of mass of the halo and δ is the local over-density at the point where the particle is located. The pink dots correspond to particles belonging to substructures (see Section 3.2). In orange, we plot the average overdensity of the spherical shell at radius r. The local density is not a one-to-one function of the distance to the center of mass. This again illustrates the asphericity of the halo. The substructures appear in this representation as a set of particles grouped in the form of local density peaks that are superimposed on the spherical density profiles.
Current usage metrics show cumulative count of Article Views (full-text article views including HTML views, PDF and ePub downloads, according to the available data) and Abstracts Views on Vision4Press platform.
Data correspond to usage on the plateform after 2015. The current usage metrics is available 48-96 hours after online publication and is updated daily on week days.
Initial download of the metrics may take a while.