Fig. 2
Download original image
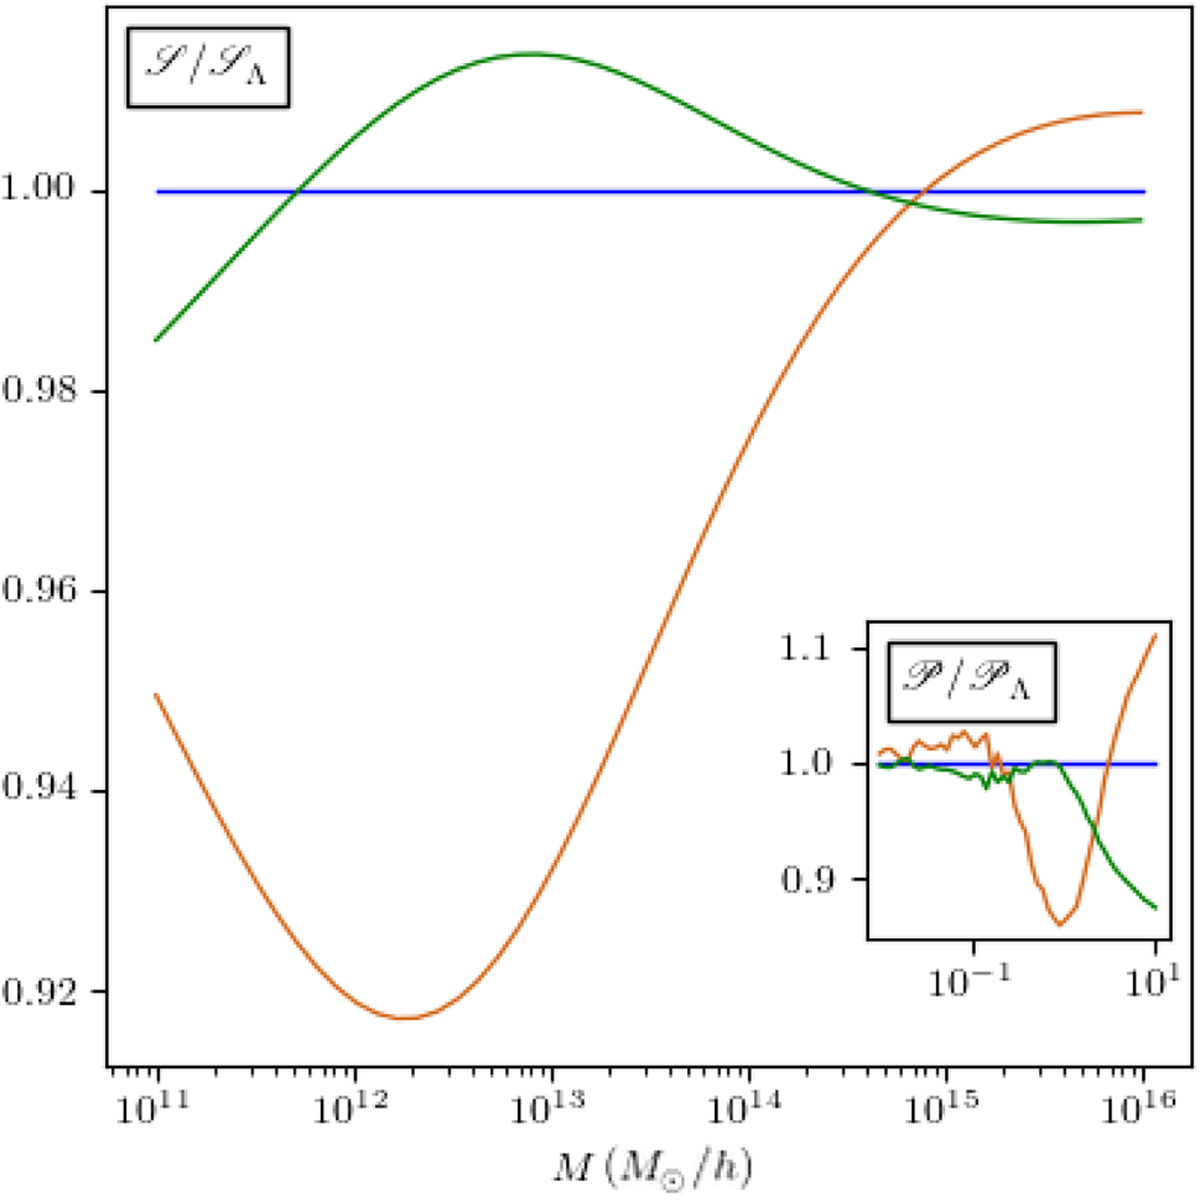
Ratio to the ΛCDM (blue) model as a function of the smoothing mass M of the purely nonlinear rms fluctuations ℒ = σNL/σL for RPCDM (orange) and wCDM (green) models. In the internal panel, we plot, in the same way, the ratio to the ΛCDM model of the purely nonlinear power spectrum 𝒫 = PNL/PL of each model. We note that 𝒫RPCDM (orange) closely follows 𝒫ΛCDM (blue) up to kC = 0.4 h Mpc, after which it deviates significantly. For the wCDM model (green), the purely nonlinear spectra are very distinct above kC = 1. h Mpc. On the purely nonlinear ratios of rms fluctuations, the difference is strong on mass scales 1012−1014 M⊙/h. It is precisely this range of mass that we will study from the DM halos.
Current usage metrics show cumulative count of Article Views (full-text article views including HTML views, PDF and ePub downloads, according to the available data) and Abstracts Views on Vision4Press platform.
Data correspond to usage on the plateform after 2015. The current usage metrics is available 48-96 hours after online publication and is updated daily on week days.
Initial download of the metrics may take a while.