Fig. 5
Download original image
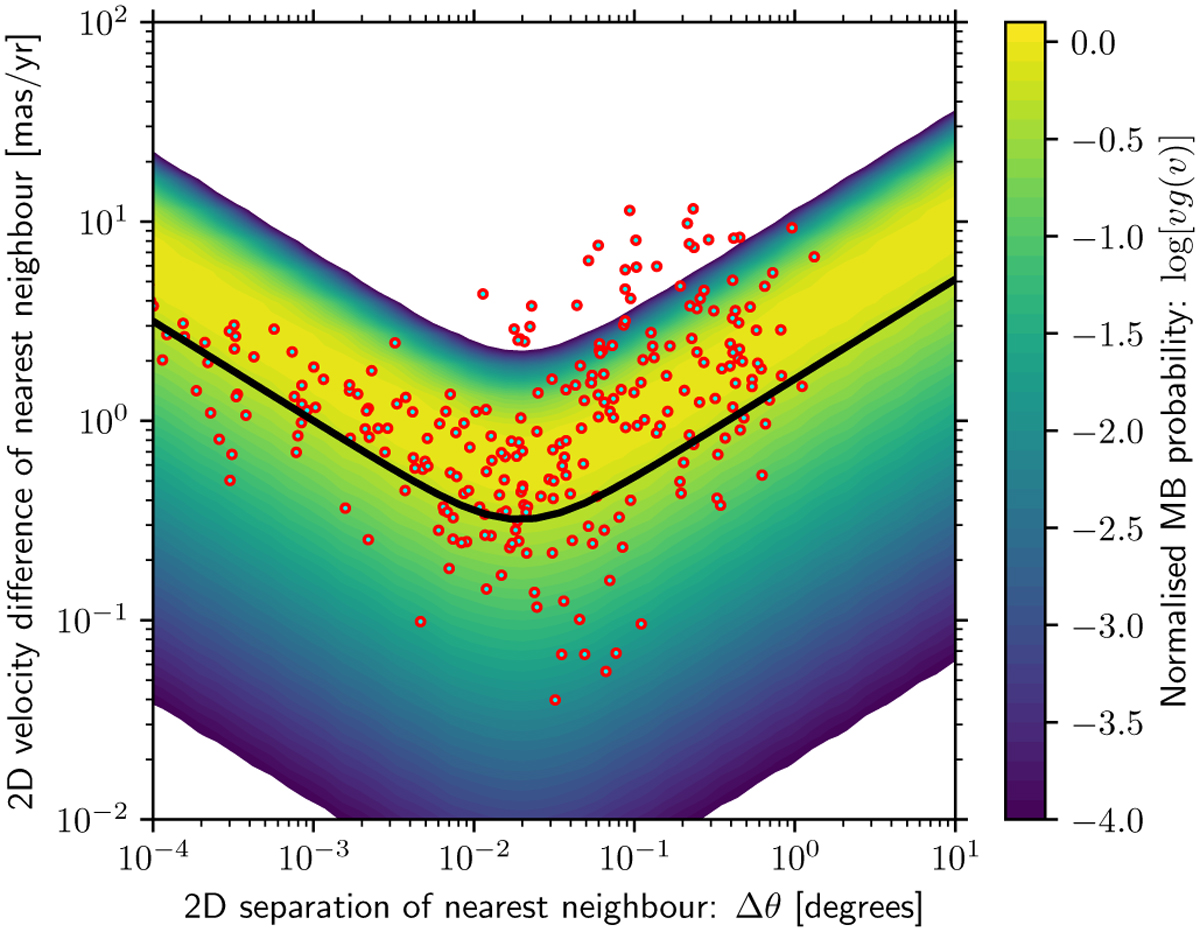
Proper motion difference versus angular separation assuming a distance of 140 pc for nearest neighbours from the initial conditions in our model. The black line shows the one dimensional velocity dispersion as a function of separation and the colour bar shows the normalised Maxwell-Boltzmann distribution for each separation, as in Figure 1.
Current usage metrics show cumulative count of Article Views (full-text article views including HTML views, PDF and ePub downloads, according to the available data) and Abstracts Views on Vision4Press platform.
Data correspond to usage on the plateform after 2015. The current usage metrics is available 48-96 hours after online publication and is updated daily on week days.
Initial download of the metrics may take a while.