Fig. 4
Download original image
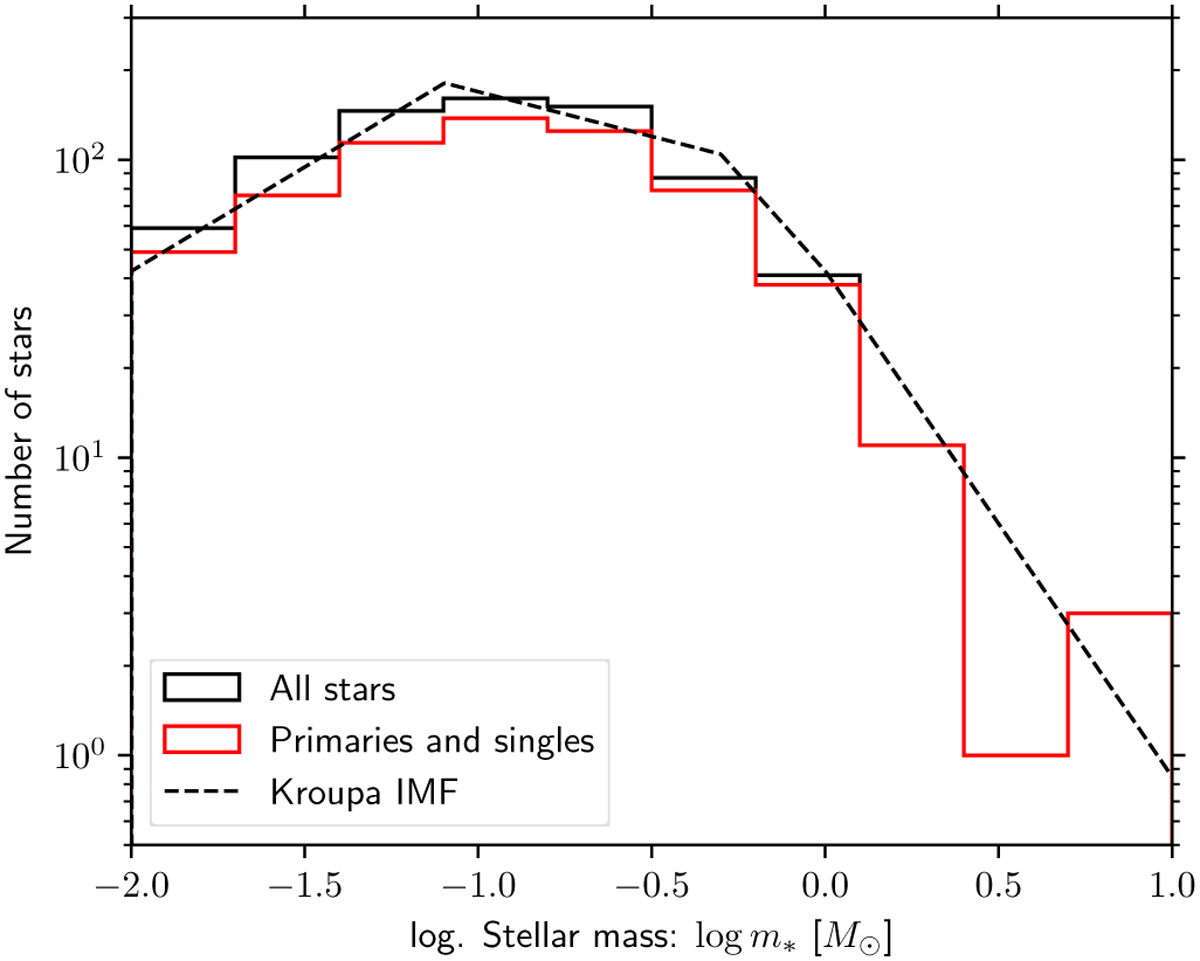
Histogram of stellar masses in our dynamical model for Taurus. The solid black shows all stars including binary companions, while the red line is just the primaries and single stars. The black dashed line corresponds to the number that would be expected in each bin from the Kroupa (2001) IMF (Equation (5)). The bin sizes are similar to those adopted by Luhman (2004) in Figure 13, top panel.
Current usage metrics show cumulative count of Article Views (full-text article views including HTML views, PDF and ePub downloads, according to the available data) and Abstracts Views on Vision4Press platform.
Data correspond to usage on the plateform after 2015. The current usage metrics is available 48-96 hours after online publication and is updated daily on week days.
Initial download of the metrics may take a while.