Fig. 8
Download original image
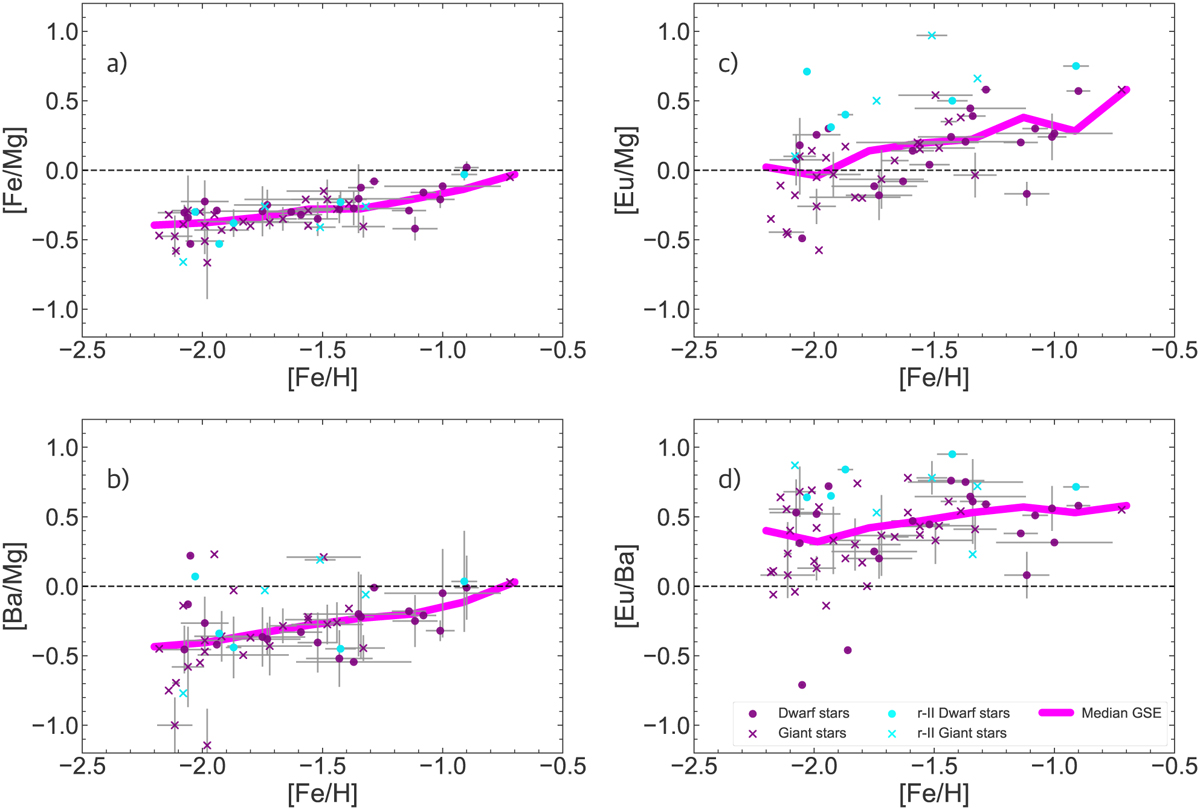
Gaia-Sausage-Enceladus stars selected from the SAGA database (Sect. 2). Panels show elemental abundance ratios as a function of [Fe/H]: (a) [Fe/Mg]; (b) [Ba/Mg]; (c) [Eu/Mg]; and (d) [Eu/Ba]. Different symbols are dwarf (circles) and giant (x-symbols) stars. r-II stars are shown in cyan and r-normal stars shown in purple. Median trends are shown with pink lines.
Current usage metrics show cumulative count of Article Views (full-text article views including HTML views, PDF and ePub downloads, according to the available data) and Abstracts Views on Vision4Press platform.
Data correspond to usage on the plateform after 2015. The current usage metrics is available 48-96 hours after online publication and is updated daily on week days.
Initial download of the metrics may take a while.