Open Access
Fig. B.1.
Download original image
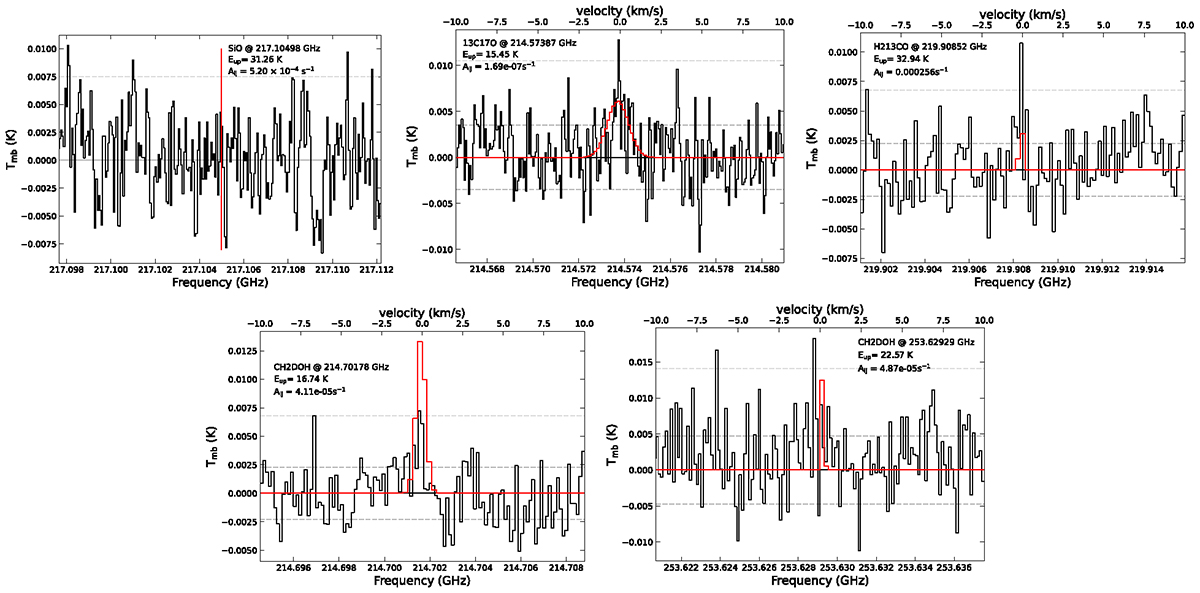
Notable non-detections in the data. The 3×rms value is indicated by the dashed, light gray line, the rms value is indicated by the dashed, dark gray line. The position of the targeted SiO transition is indicated by the red line, for the remaining lines the attempt to fit a Gaussian to the data is displayed in red.
Current usage metrics show cumulative count of Article Views (full-text article views including HTML views, PDF and ePub downloads, according to the available data) and Abstracts Views on Vision4Press platform.
Data correspond to usage on the plateform after 2015. The current usage metrics is available 48-96 hours after online publication and is updated daily on week days.
Initial download of the metrics may take a while.