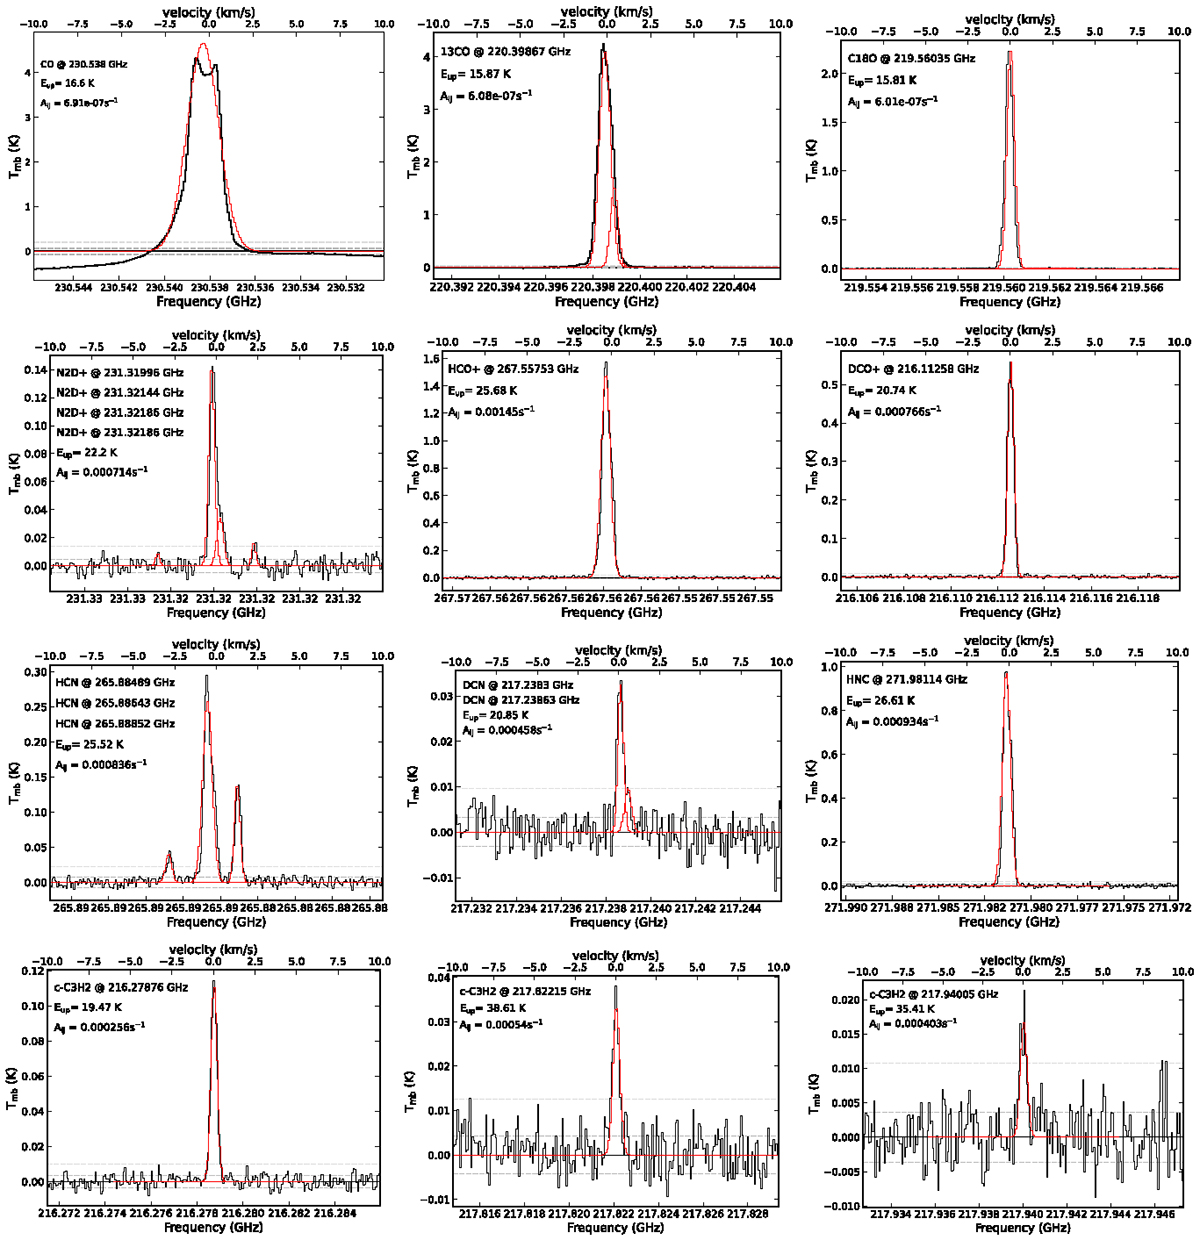
Fig. A.1.
Download original image
Spectra of the securely detected transitions (Table A.1) overlaid with the Gaussian best-fit model in red (Table A.1). Not all lines are perfectly fit by a Gaussian, kinematics or line broadening are factors that can influence the line shape, in the case of CO and 13CO two components are used to fit the line. It is also to note that due to the large beam size of 26.2″ different physical components are not resolved, and emission is picked up from multiple components. The dashed, dark gray line indicates the 3×rms value, the dashed, light gray line indicates the rms value.
Current usage metrics show cumulative count of Article Views (full-text article views including HTML views, PDF and ePub downloads, according to the available data) and Abstracts Views on Vision4Press platform.
Data correspond to usage on the plateform after 2015. The current usage metrics is available 48-96 hours after online publication and is updated daily on week days.
Initial download of the metrics may take a while.