Fig. 7
Download original image
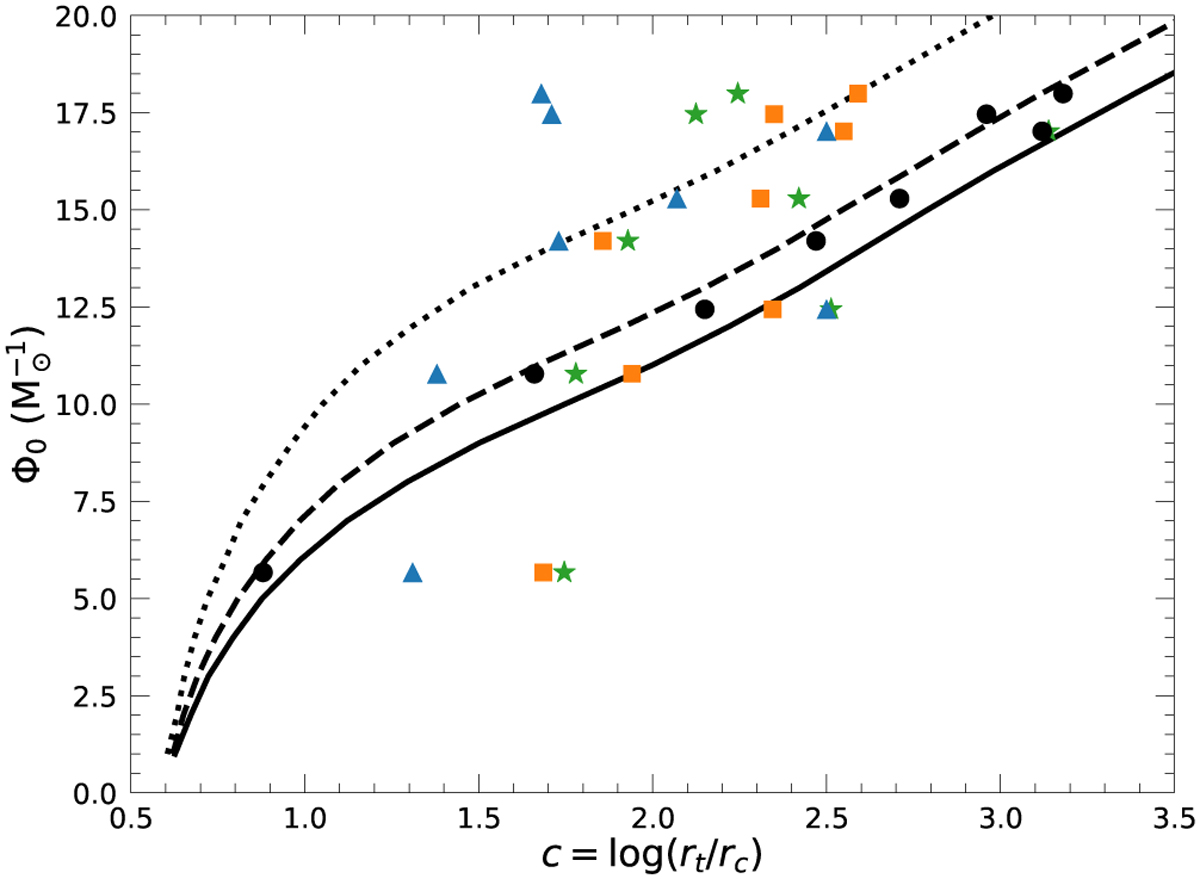
Relation between Φ0 and the concentration c = log(rt/rc). The continuous, dashed, and dotted lines represent, respectively, the theoretical prediction with a mass function slope α = 0.0, α = −1.0, and α = −2.0, while the black circles show the constrained values of Φ0 and c for the analyzed clusters. The blue triangles show the King concentration from the Harris (1996) catalog (2010 edition), while the orange squares and green stars are computed using the core radius from the Harris (1996) and Baumgardt (2018–2023) catalogs respectively, and the tidal radius from Webb et al. (2013).
Current usage metrics show cumulative count of Article Views (full-text article views including HTML views, PDF and ePub downloads, according to the available data) and Abstracts Views on Vision4Press platform.
Data correspond to usage on the plateform after 2015. The current usage metrics is available 48-96 hours after online publication and is updated daily on week days.
Initial download of the metrics may take a while.