Open Access
Fig. 6
Download original image
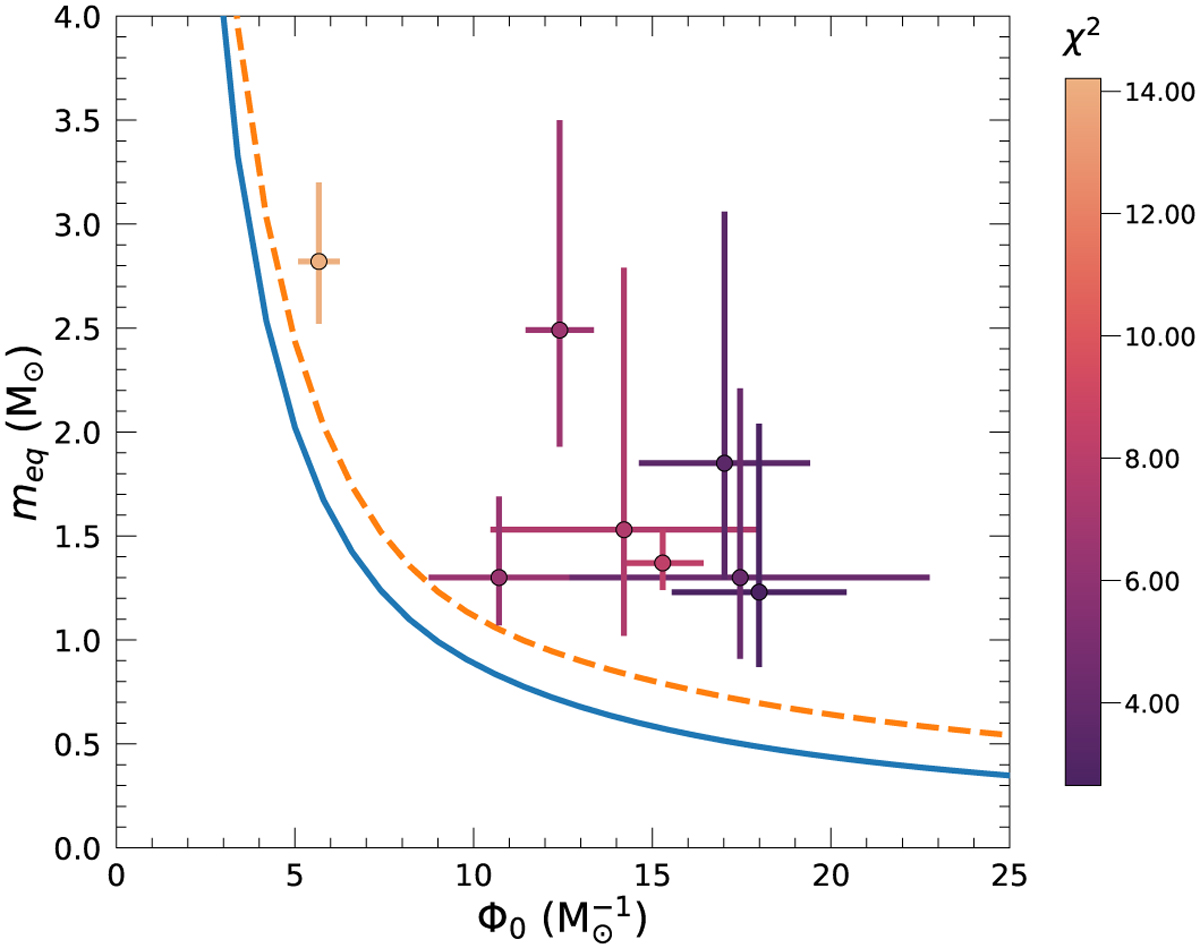
Equipartition mass meq in the core (r ≤ rc) as function of Φ0. The blue continuous line and the orange dashed line are the 3D and 2D theoretical predictions, respectively. The circles with error bars are the same as in Fig. 2.
Current usage metrics show cumulative count of Article Views (full-text article views including HTML views, PDF and ePub downloads, according to the available data) and Abstracts Views on Vision4Press platform.
Data correspond to usage on the plateform after 2015. The current usage metrics is available 48-96 hours after online publication and is updated daily on week days.
Initial download of the metrics may take a while.