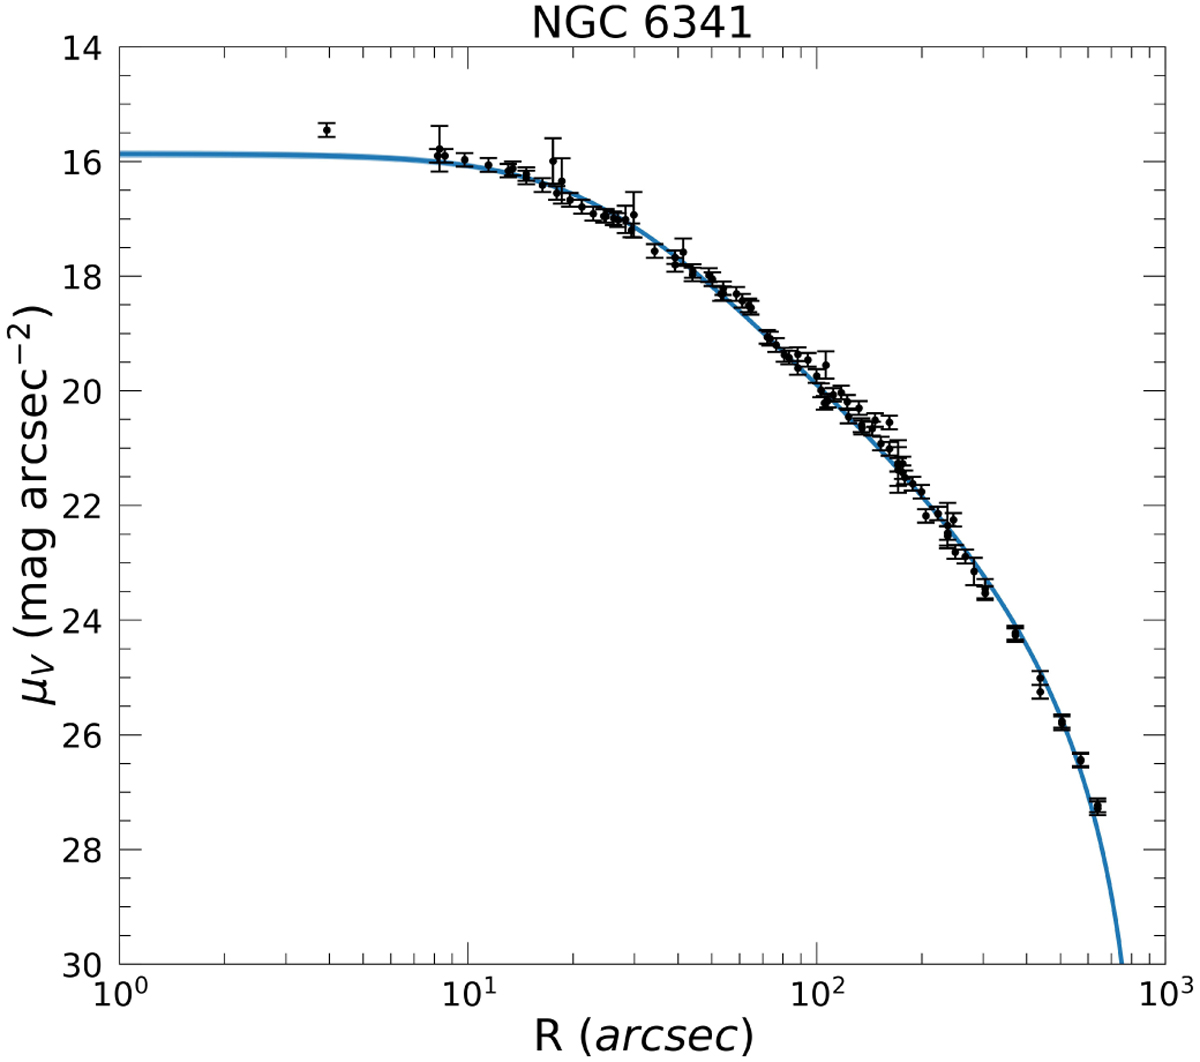
Fig. 10
Download original image
Surface brightness profile for NGC 6341. The black circles with error bars are the data from Trager et al. (1995) analyzed following the work by McLaughlin & van der Marel (2005) and Zocchi et al. (2012). The continuous blue line is our model best fit with its confidence band, which is obtained by assuming the Baumgardt et al. (2023) mass function slope and adopting the BaSTI isochrones (Hidalgo et al. 2018; Pietrinferni et al. 2021; Salaris et al. 2022; Pietrinferni et al. 2024) with 13 Gyr, [α/Fe] = +0.4, Y = 0.247, and metallicity [Fe/H]=−2.31, taken from the Harris (1996) catalog (2010 edition).
Current usage metrics show cumulative count of Article Views (full-text article views including HTML views, PDF and ePub downloads, according to the available data) and Abstracts Views on Vision4Press platform.
Data correspond to usage on the plateform after 2015. The current usage metrics is available 48-96 hours after online publication and is updated daily on week days.
Initial download of the metrics may take a while.