Fig. 1
Download original image
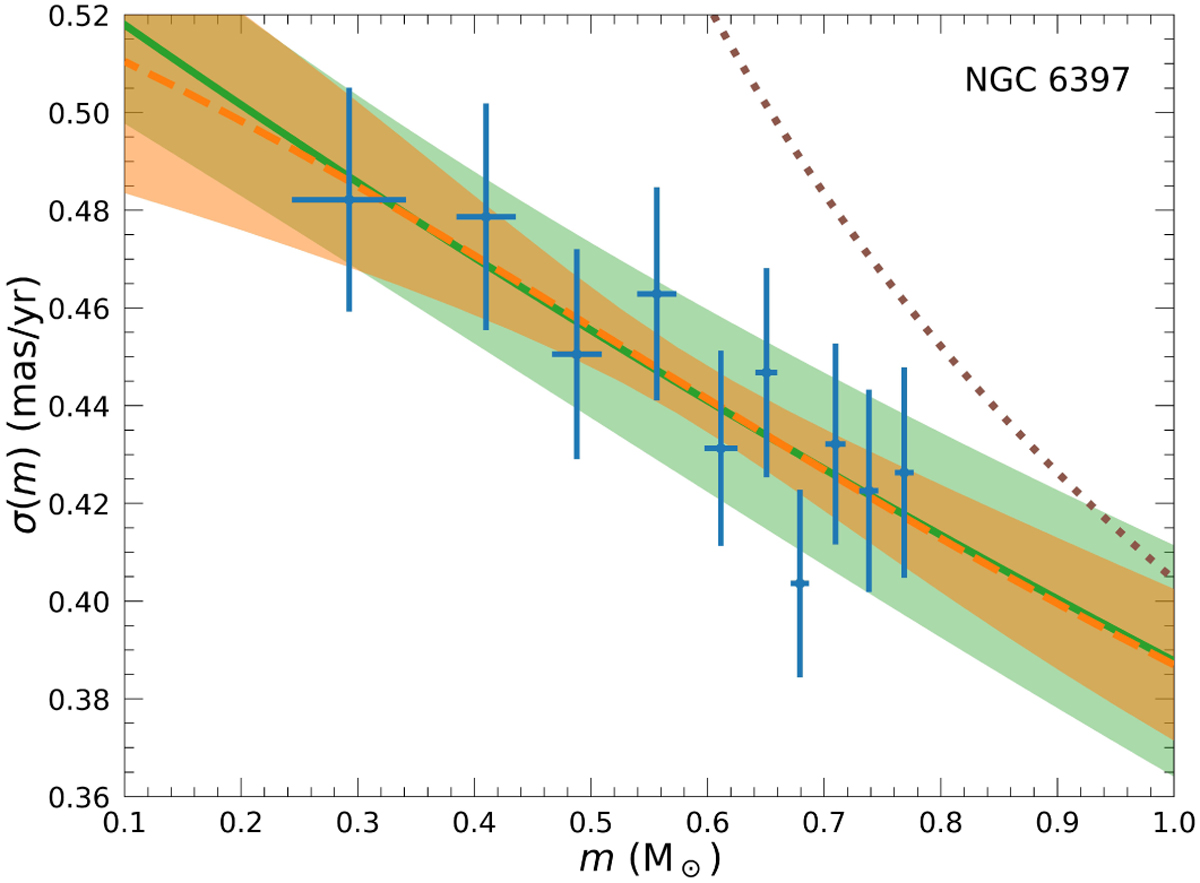
Projected velocity dispersion as a function of stellar mass for NGC 6397. The error bars are the data from Watkins et al. (2022), the continuous green line is our best fit with the Bianchini et al. (2016) fitting function in Eq. (1) with its error band, the dotted brown line is the complete equipartition limit (σ ∝ m−1/2), and the dashed orange line is our model best-fit with its 68% confidence band.
Current usage metrics show cumulative count of Article Views (full-text article views including HTML views, PDF and ePub downloads, according to the available data) and Abstracts Views on Vision4Press platform.
Data correspond to usage on the plateform after 2015. The current usage metrics is available 48-96 hours after online publication and is updated daily on week days.
Initial download of the metrics may take a while.