Fig. 6.
Download original image
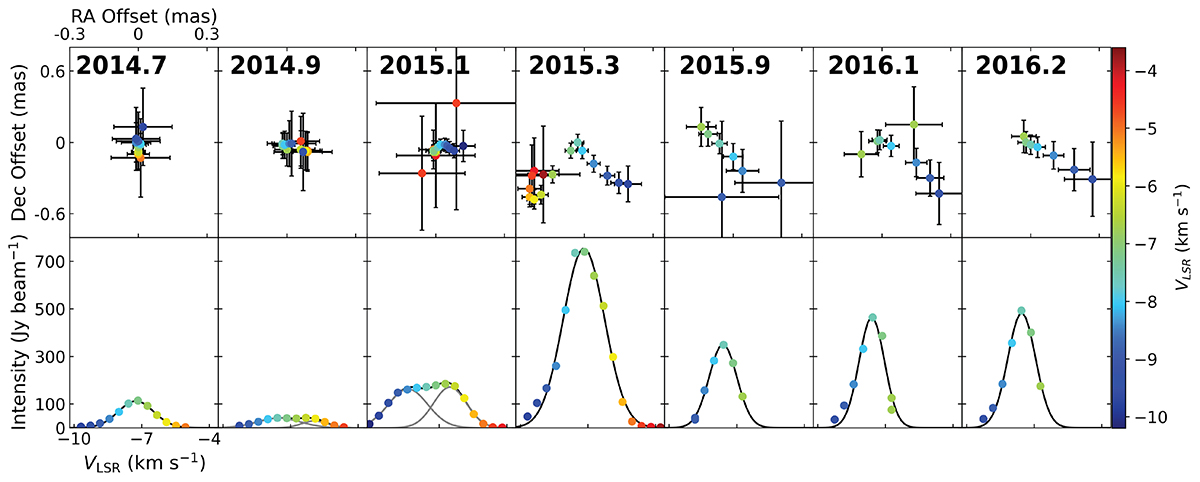
Time variation of the brightest maser feature in CM2-W2. Top panels: Offsets and VLSR of maser spots in the brightest feature of CM2-W2 for each epoch. The position, uncertainty and VLSR of each spot is shown. We note the difference in spatial scale between right ascension and declination. Bottom panels: Spectral profile of the maser spots in this feature, with Gaussian fits shown in black. In 2014.9 and 2015.1 the feature is well approximated by a double Gaussian.
Current usage metrics show cumulative count of Article Views (full-text article views including HTML views, PDF and ePub downloads, according to the available data) and Abstracts Views on Vision4Press platform.
Data correspond to usage on the plateform after 2015. The current usage metrics is available 48-96 hours after online publication and is updated daily on week days.
Initial download of the metrics may take a while.