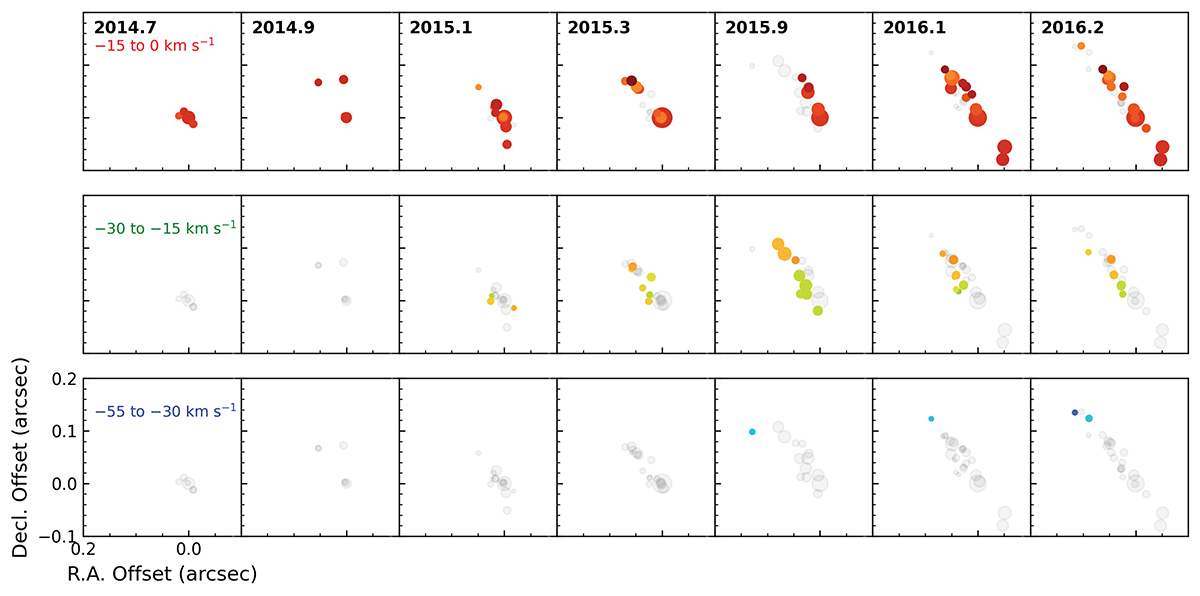
Fig. 5.
Download original image
Velocity-dependent response of the water maser features in CM2-W2. The radius of the spots is proportional to the peak flux density. The rows indicate different velocity bins as indicated in the panels in the first column. Each column is the observation shown in the first row. Maser features that are outside of the respective velocity bin are shown in grey. The spatial scale for all panels is the same. The offset is in terms of the reference maser feature.
Current usage metrics show cumulative count of Article Views (full-text article views including HTML views, PDF and ePub downloads, according to the available data) and Abstracts Views on Vision4Press platform.
Data correspond to usage on the plateform after 2015. The current usage metrics is available 48-96 hours after online publication and is updated daily on week days.
Initial download of the metrics may take a while.