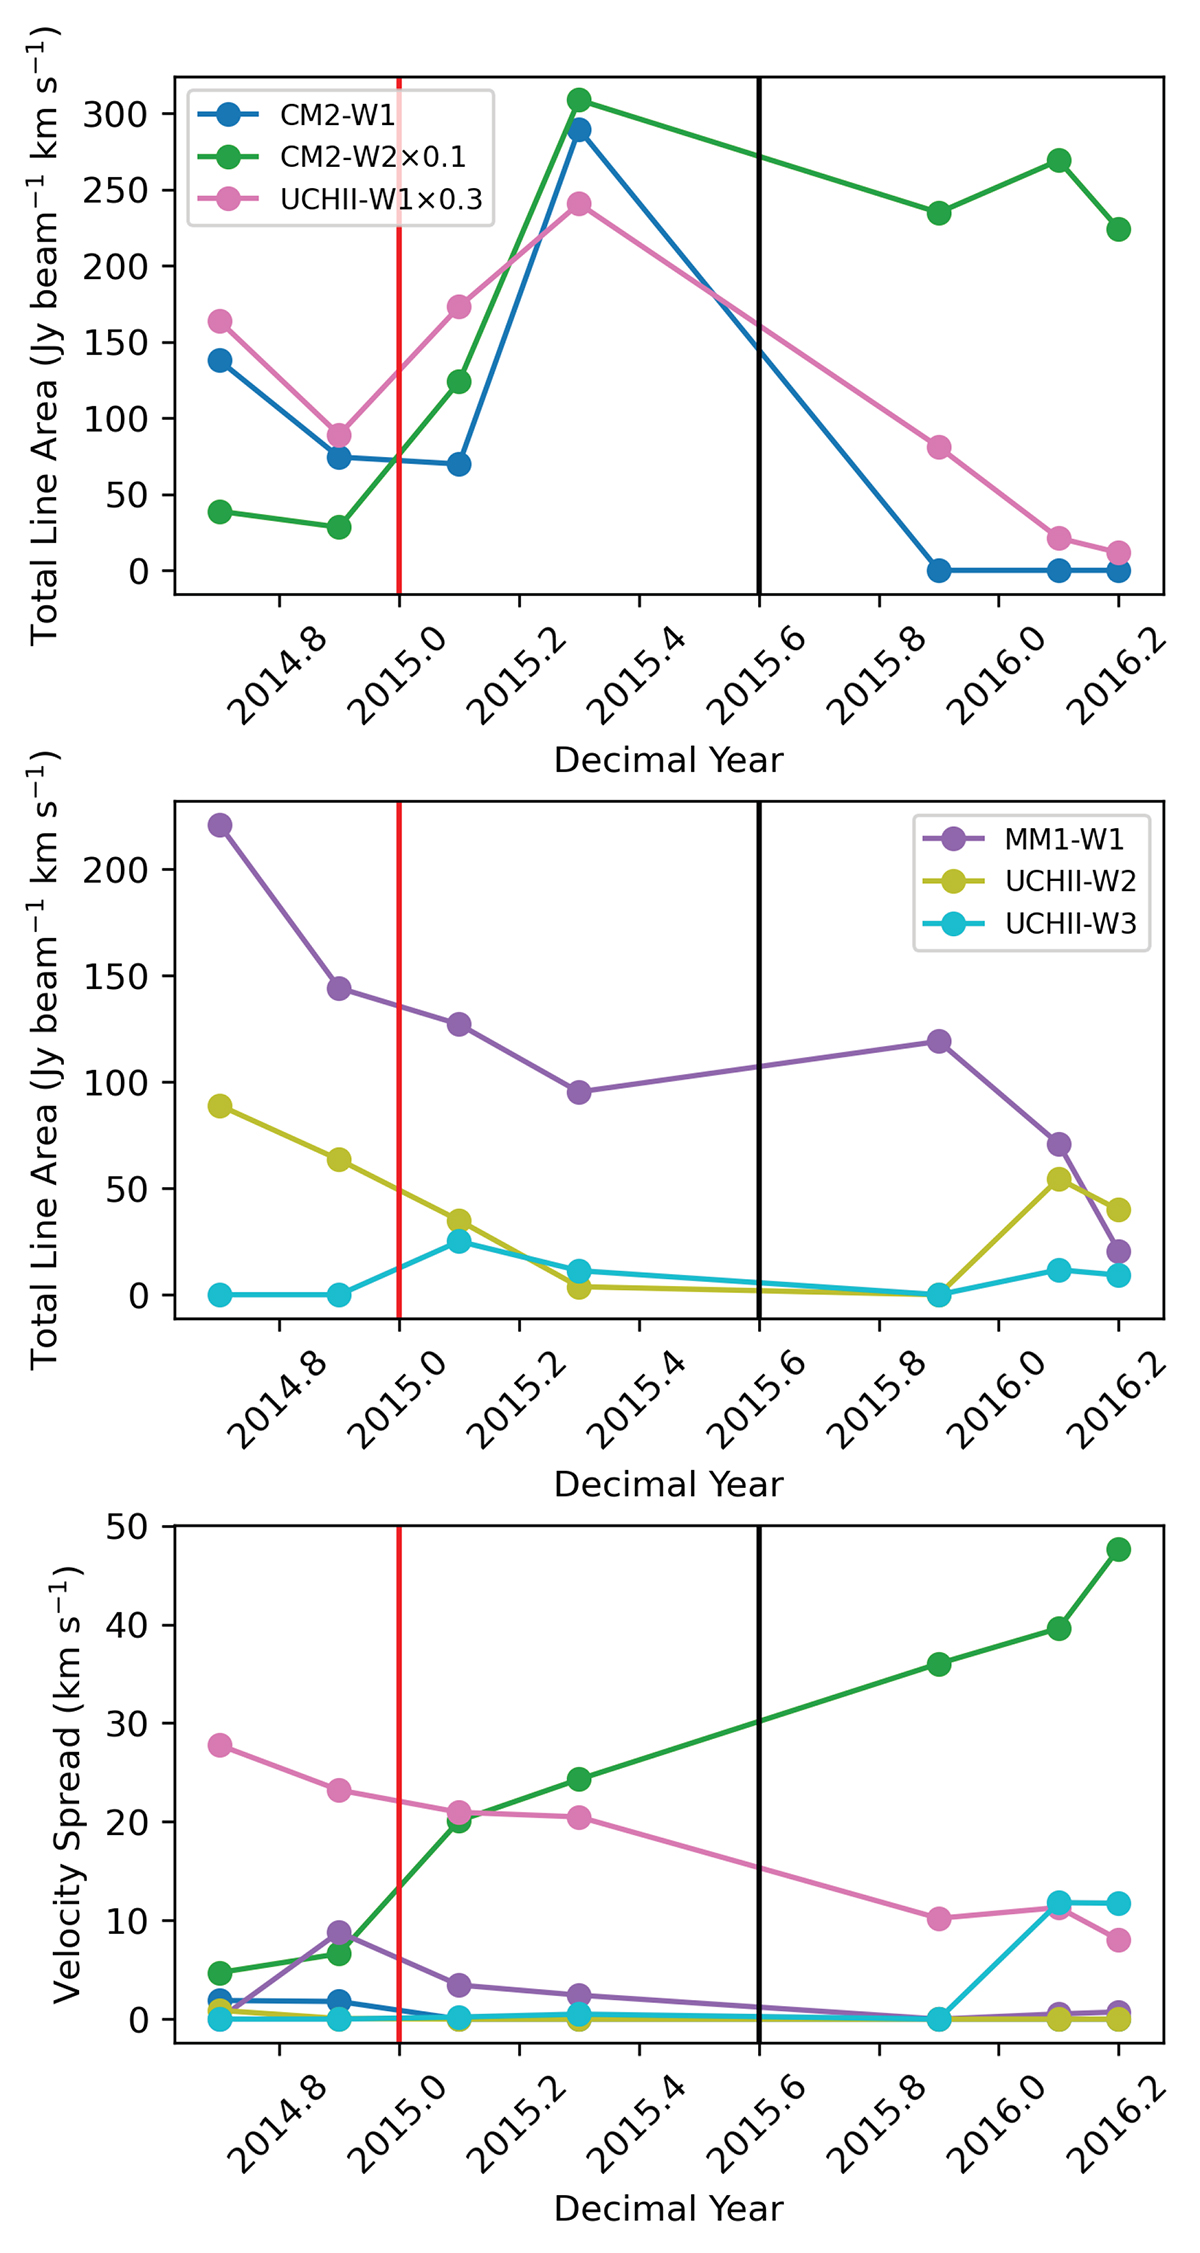
Fig. 4.
Download original image
Time dependence of total velocity integrated intensity (line area) and velocity spread for each association from our VERA observations. The first and second panel shows respectively the line area for associations containing increasing and decreasing trends at the onset of the burst. The third panel shows the velocity spread for each association over time. The colours for the third panel are the same as in the legends in the first two panels. The red and black lines indicate the date of the onset and peak of the burst, respectively.
Current usage metrics show cumulative count of Article Views (full-text article views including HTML views, PDF and ePub downloads, according to the available data) and Abstracts Views on Vision4Press platform.
Data correspond to usage on the plateform after 2015. The current usage metrics is available 48-96 hours after online publication and is updated daily on week days.
Initial download of the metrics may take a while.