Fig. 3.

Download original image
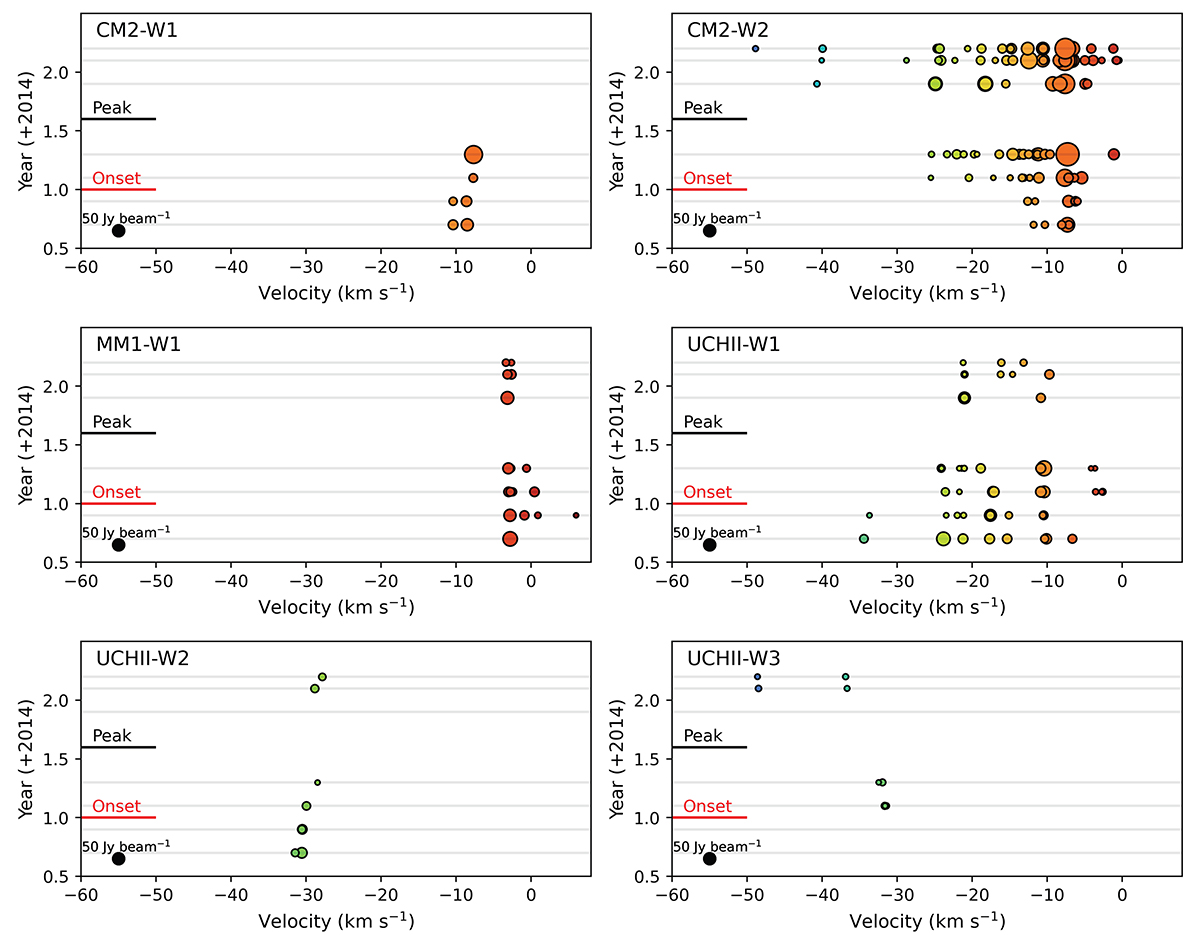
Centre velocities and peak intensities of maser features in each association over time. The marker size is proportional to the square of the feature peak intensity (![]() ). A scale for the marker size is shown at the bottom left of each panel. The markers are colour-coded according to velocity. The grey horizontal lines indicate the dates of our observations. The date of the onset and peak of the accretion burst traced by 6.7 GHz methanol masers is shown in red and black, respectively (MacLeod et al. 2018).
). A scale for the marker size is shown at the bottom left of each panel. The markers are colour-coded according to velocity. The grey horizontal lines indicate the dates of our observations. The date of the onset and peak of the accretion burst traced by 6.7 GHz methanol masers is shown in red and black, respectively (MacLeod et al. 2018).
Current usage metrics show cumulative count of Article Views (full-text article views including HTML views, PDF and ePub downloads, according to the available data) and Abstracts Views on Vision4Press platform.
Data correspond to usage on the plateform after 2015. The current usage metrics is available 48-96 hours after online publication and is updated daily on week days.
Initial download of the metrics may take a while.


