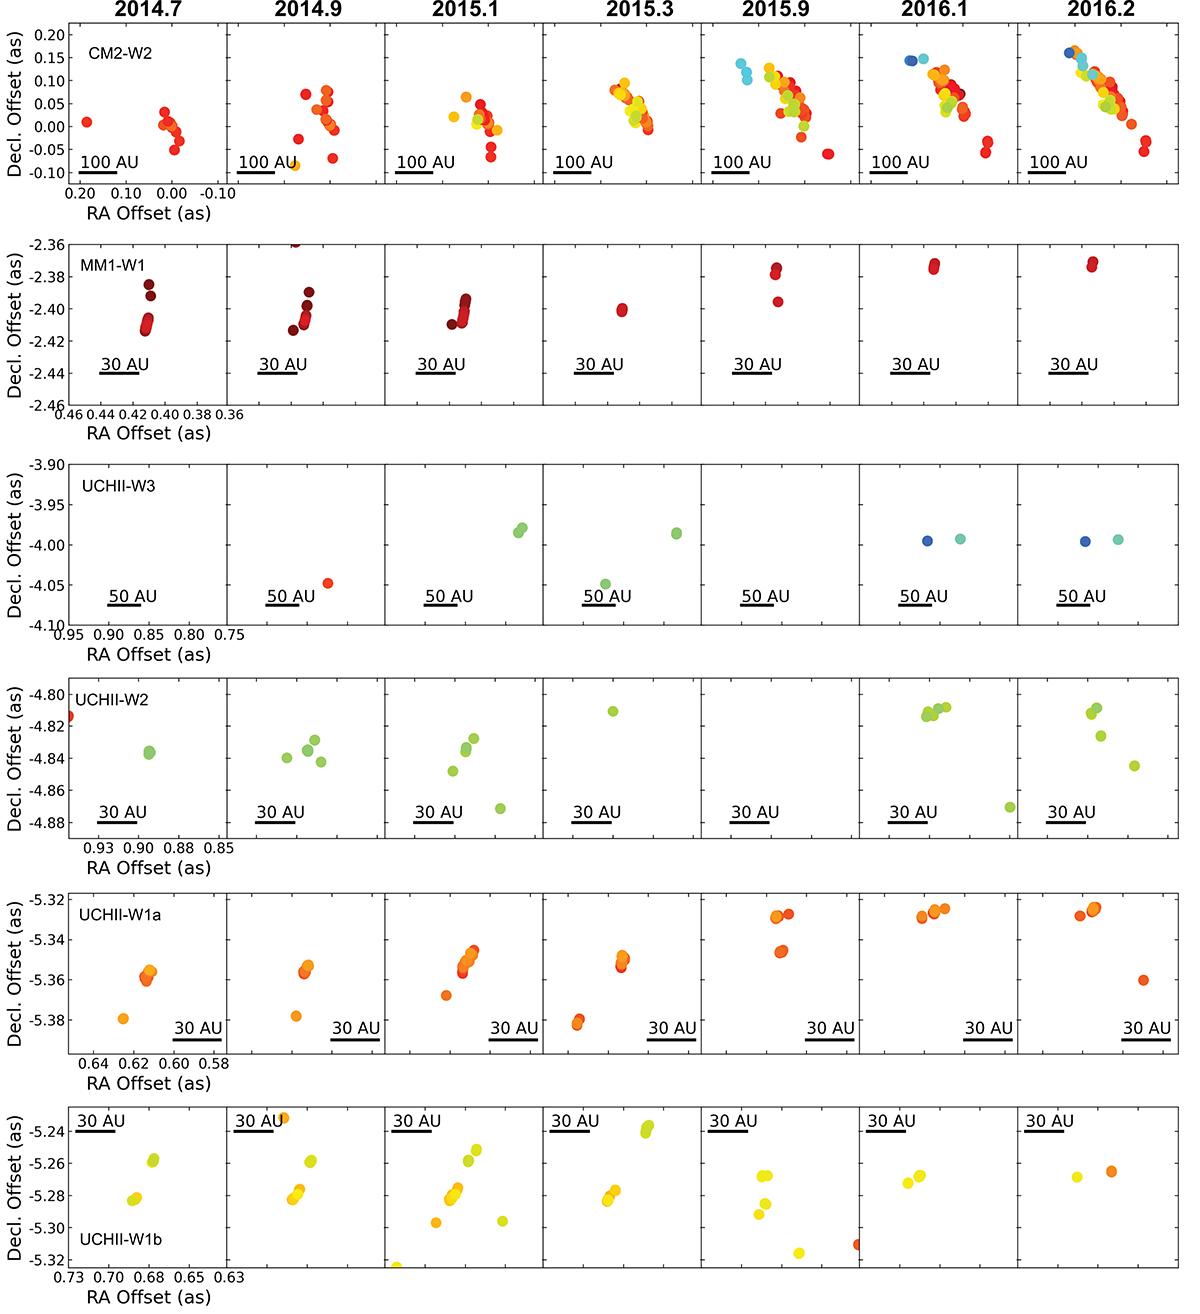
Fig. B.1.
Download original image
Water maser spot positions epochs 2014.7−2016.2. Each horizontal panel shows a different association over time, with the name of the region in the leftmost panel. The spatial scale is constant over epochs for each association. The dates of observation are shown above the top panel. A linear scale is shown in each panel. The colour scale is the same as Figure 2.
Current usage metrics show cumulative count of Article Views (full-text article views including HTML views, PDF and ePub downloads, according to the available data) and Abstracts Views on Vision4Press platform.
Data correspond to usage on the plateform after 2015. The current usage metrics is available 48-96 hours after online publication and is updated daily on week days.
Initial download of the metrics may take a while.