Fig. 11.
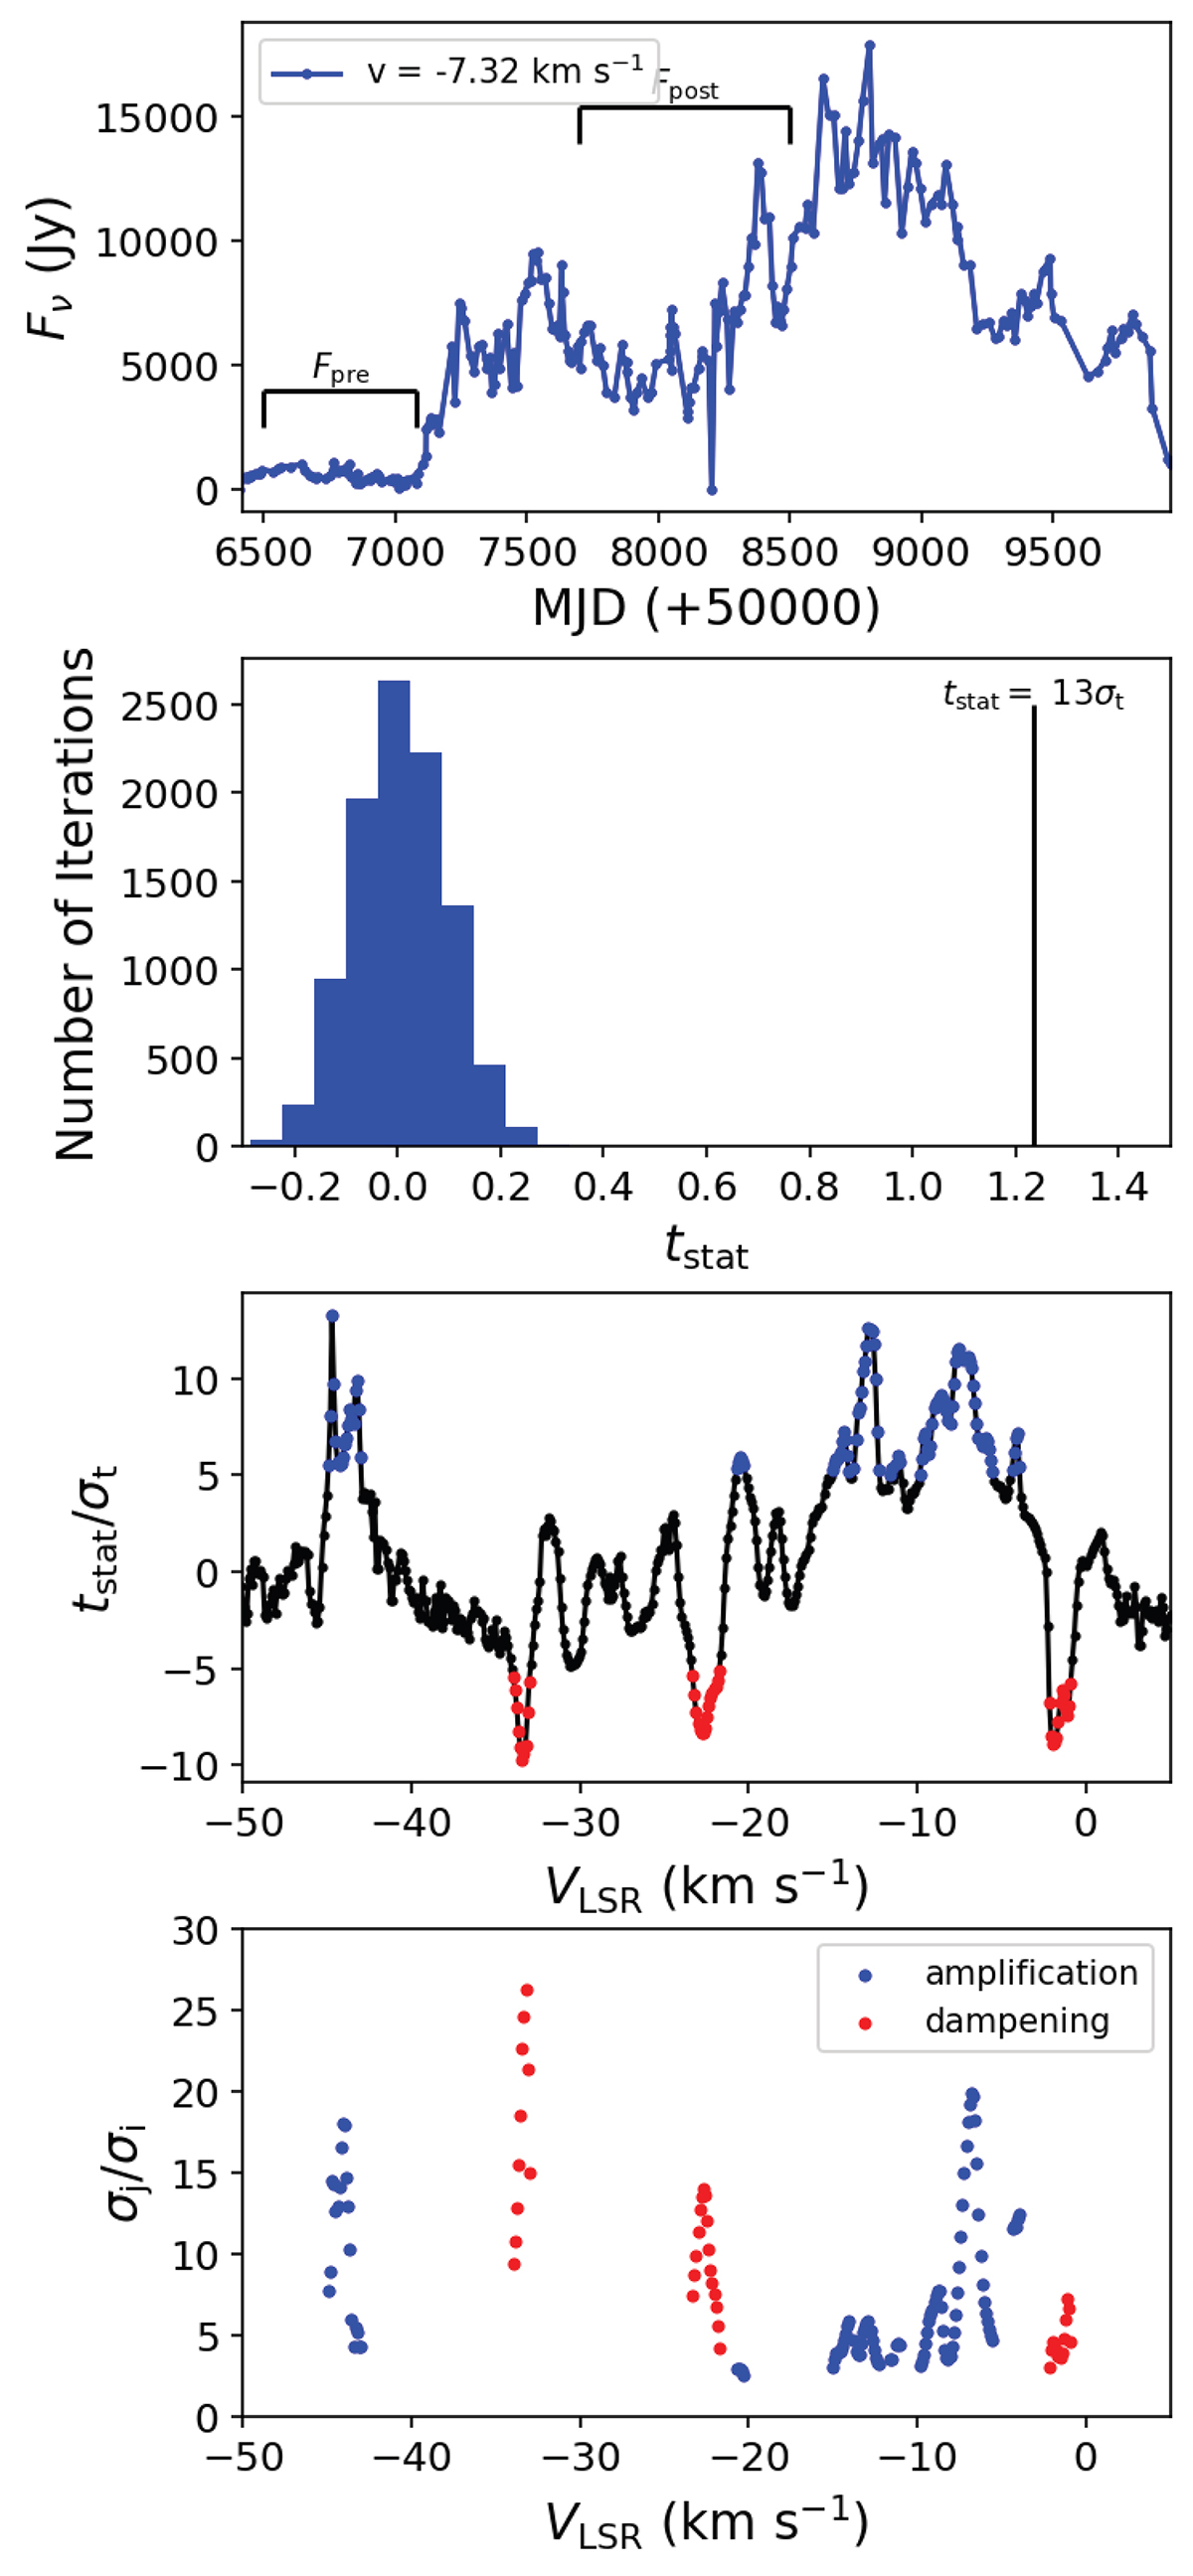
Download original image
Permutation test of 22 GHz water maser long-term time series taken with HartRAO. Top panel: Example time series of the −7.32 km s−1 velocity time series. The pre-burst and burst time windows are annotated. Second panel: Distribution of tstat for 104 iterations where the array is shuffled for the −7.32 km s−1 time series. The value of the unshuffled time series is shown as the black line. Third panel: Value of the ratio of the unshuffled tstat over the standard deviation of the shuffled distribution. The velocity channels that have a statistically significant increased and decreased dispersion are shown in blue and red, respectively. Bottom panel: Dispersion ratio for channels where there were statistically significant changes. The blue points are σburst/σpre where the dispersion increased, while the red points are σpre/σburst where the dispersion decreased.
Current usage metrics show cumulative count of Article Views (full-text article views including HTML views, PDF and ePub downloads, according to the available data) and Abstracts Views on Vision4Press platform.
Data correspond to usage on the plateform after 2015. The current usage metrics is available 48-96 hours after online publication and is updated daily on week days.
Initial download of the metrics may take a while.