Fig. 10.
Download original image
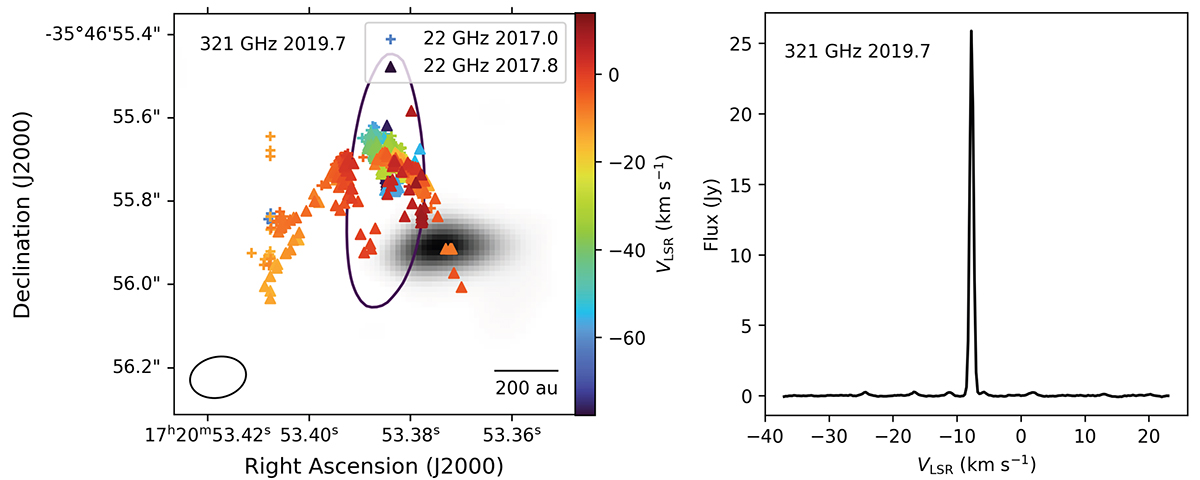
Detection of the 321 GHz water maser with ALMA. Left: Integrated intensity map of 2019.7 321 GHz water masers as detected with ALMA in greyscale. The coloured crosses and triangles show the peak positions of 22 GHz water masers detected in 2017.0 and 2017.8, respectively, while the purple contour is the 5 cm continuum point source (Brogan et al. 2018). The ALMA beam and linear scale are shown at the bottom left and bottom right, respectively. Right: Spatially integrated spectrum of the 321 GHz water masers. The small peaks are HCOOCH3 thermal line emission, which is close to 321 GHz.
Current usage metrics show cumulative count of Article Views (full-text article views including HTML views, PDF and ePub downloads, according to the available data) and Abstracts Views on Vision4Press platform.
Data correspond to usage on the plateform after 2015. The current usage metrics is available 48-96 hours after online publication and is updated daily on week days.
Initial download of the metrics may take a while.