Open Access
Fig. 9
Download original image
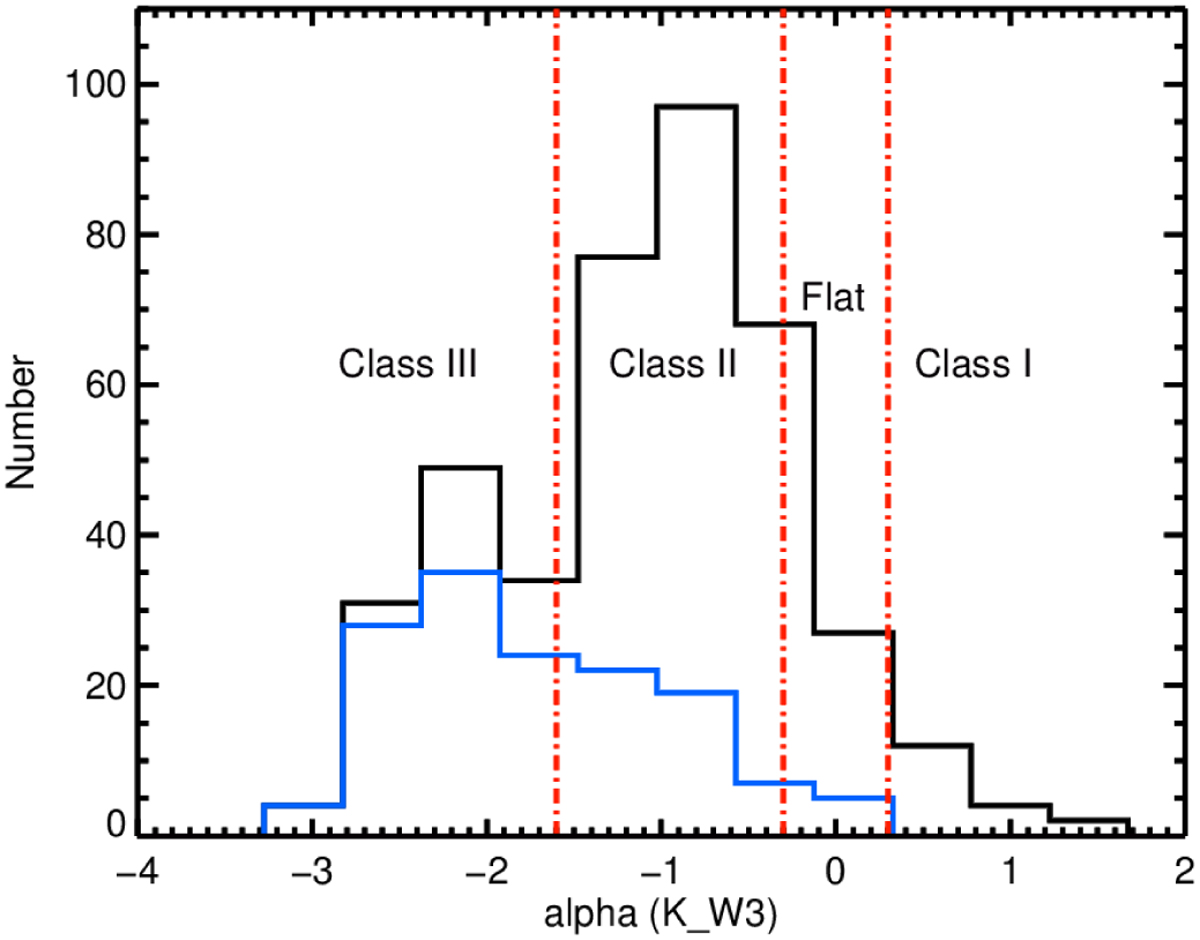
Distribution of α for 549 variables. The spectral index, α, has been determined between 2.2 µm (2MASS) and 12 µm (W3, WISE). The black and blue histograms shows the 405 nonperiodic and 144 periodic objects, respectively. The boundaries between the classes are marked as red dash-dotted lines.
Current usage metrics show cumulative count of Article Views (full-text article views including HTML views, PDF and ePub downloads, according to the available data) and Abstracts Views on Vision4Press platform.
Data correspond to usage on the plateform after 2015. The current usage metrics is available 48-96 hours after online publication and is updated daily on week days.
Initial download of the metrics may take a while.